

Question: TABLE 1; TABLE:2 Descriptive Statistics N Minimum Maximum Mean Std. Deviation Instruction2 30 2 5 4.00 1.017 Instruction6 30 2 5 3.87 .937 Instruction1
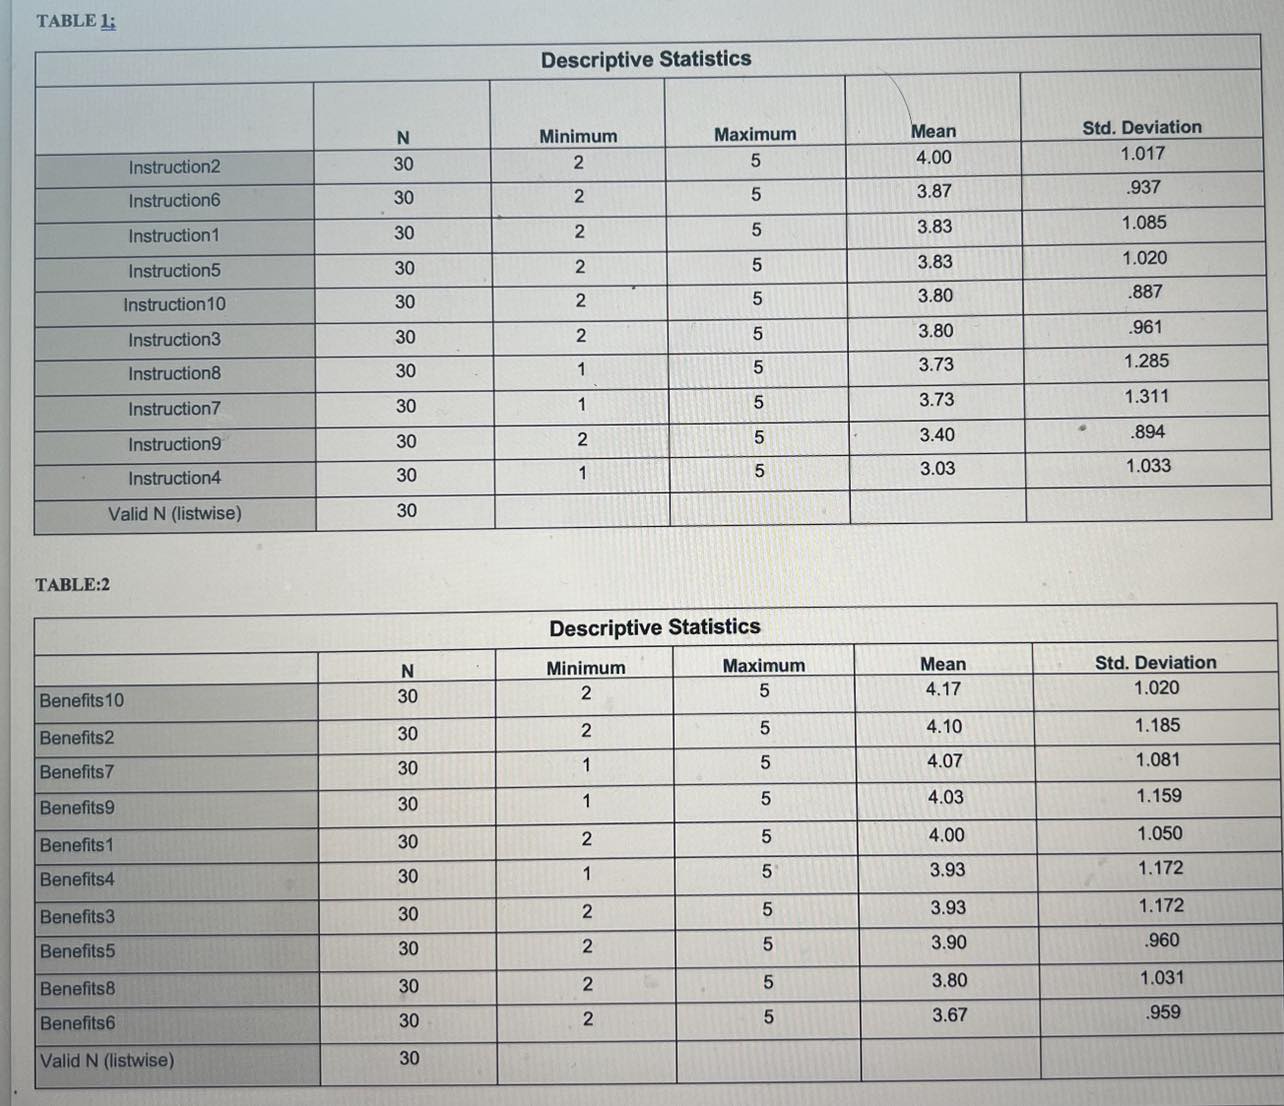
TABLE 1; TABLE:2 Descriptive Statistics N Minimum Maximum Mean Std. Deviation Instruction2 30 2 5 4.00 1.017 Instruction6 30 2 5 3.87 .937 Instruction1 30 2 5 3.83 1.085 Instruction5 30 2 5 3.83 1.020 Instruction 10 30 2 5 3.80 .887 Instruction3 30 2 5 3.80 .961 Instruction8 30 1 5 3.73 1.285 Instruction7 30 1 5 3.73 1.311 Instruction9 30 2 5 3.40 .894 Instruction4 30 1 5 3.03 1.033 Valid N (listwise) 30 Descriptive Statistics N Minimum Maximum Mean Std. Deviation Benefits 10 30 2 5 4.17 1.020 Benefits2 30 2 5 4.10 1.185 Benefits7 30 1 5 4.07 1.081 Benefits9 30 1 5 4.03 1.159 Benefits1 30 2 5 4.00 1.050 Benefits4 30 1 5 3.93 1.172 Benefits3 30 2 5 3.93 1.172 Benefits5 30 2 5 3.90 .960 Benefits8 30 2 5 3.80 1.031 Benefits6 30 2 5 3.67 .959 Valid N (listwise) 30
Step by Step Solution
There are 3 Steps involved in it

Get step-by-step solutions from verified subject matter experts