

Question: Table 1 : Water allocation strategy for different drought levels 4 . 2 RECOMMENDED STEPS Step 1 Use Google Earth Pro to view the dam
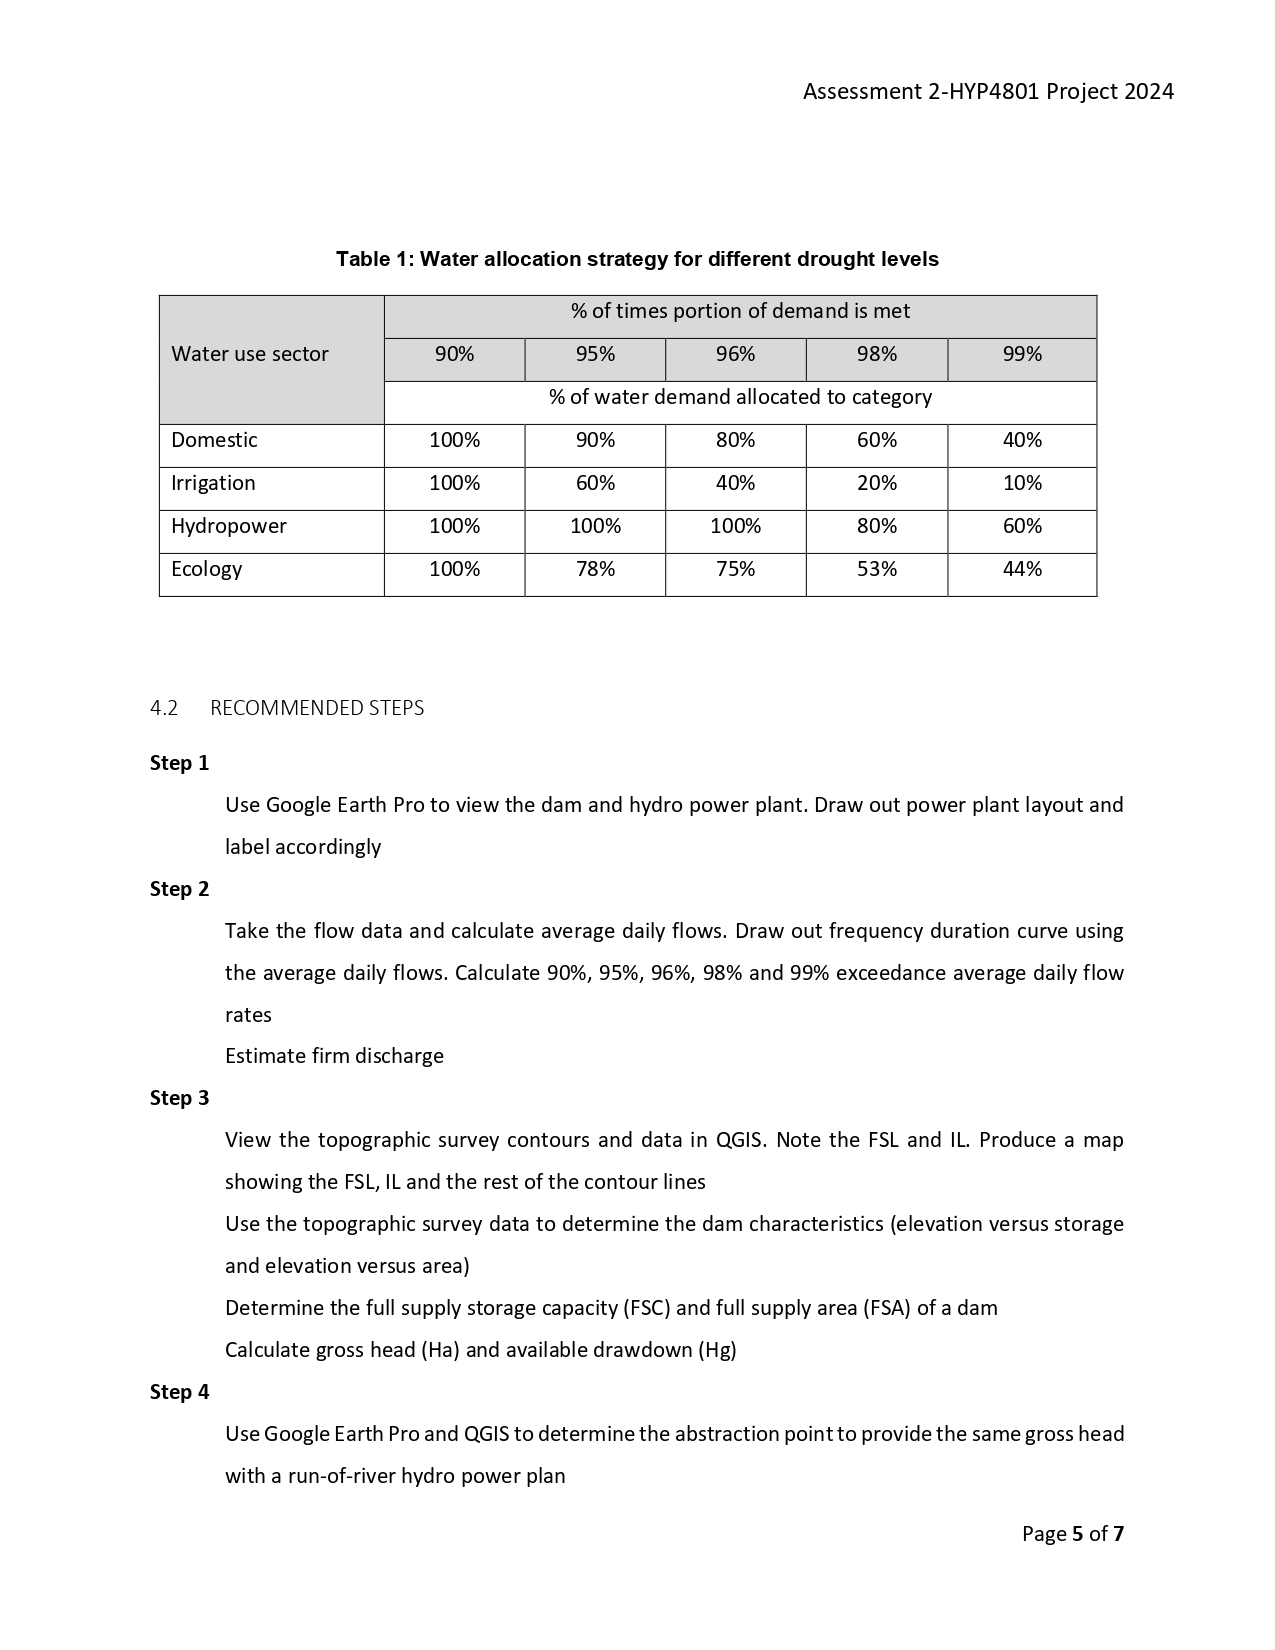
Table : Water allocation strategy for different drought levels
RECOMMENDED STEPS
Step
Use Google Earth Pro to view the dam and hydro power plant. Draw out power plant layout and
label accordingly
Step
Take the flow data and calculate average daily flows. Draw out frequency duration curve using
the average daily flows. Calculate and exceedance average daily flow
rates
Estimate firm discharge
Step
View the topographic survey contours and data in QGIS. Note the FSL and IL Produce a map
showing the FSL IL and the rest of the contour lines
Use the topographic survey data to determine the dam characteristics elevation versus storage
and elevation versus area
Determine the full supply storage capacity FSC and full supply area FSA of a dam
Calculate gross head and available drawdown
Step
Use Google Earth Pro and QGIS to determine the abstraction point to provide the same gross head
with a runofriver hydro power plan
Step by Step Solution
There are 3 Steps involved in it
1 Expert Approved Answer
Step: 1 Unlock

Question Has Been Solved by an Expert!
Get step-by-step solutions from verified subject matter experts
Step: 2 Unlock
Step: 3 Unlock