

Question: Table 11.19 Hematologic data for patients Hematology The data in Table 11.19 are given for 9 patients with aplastic anemia [12]. *11.1 Fit a
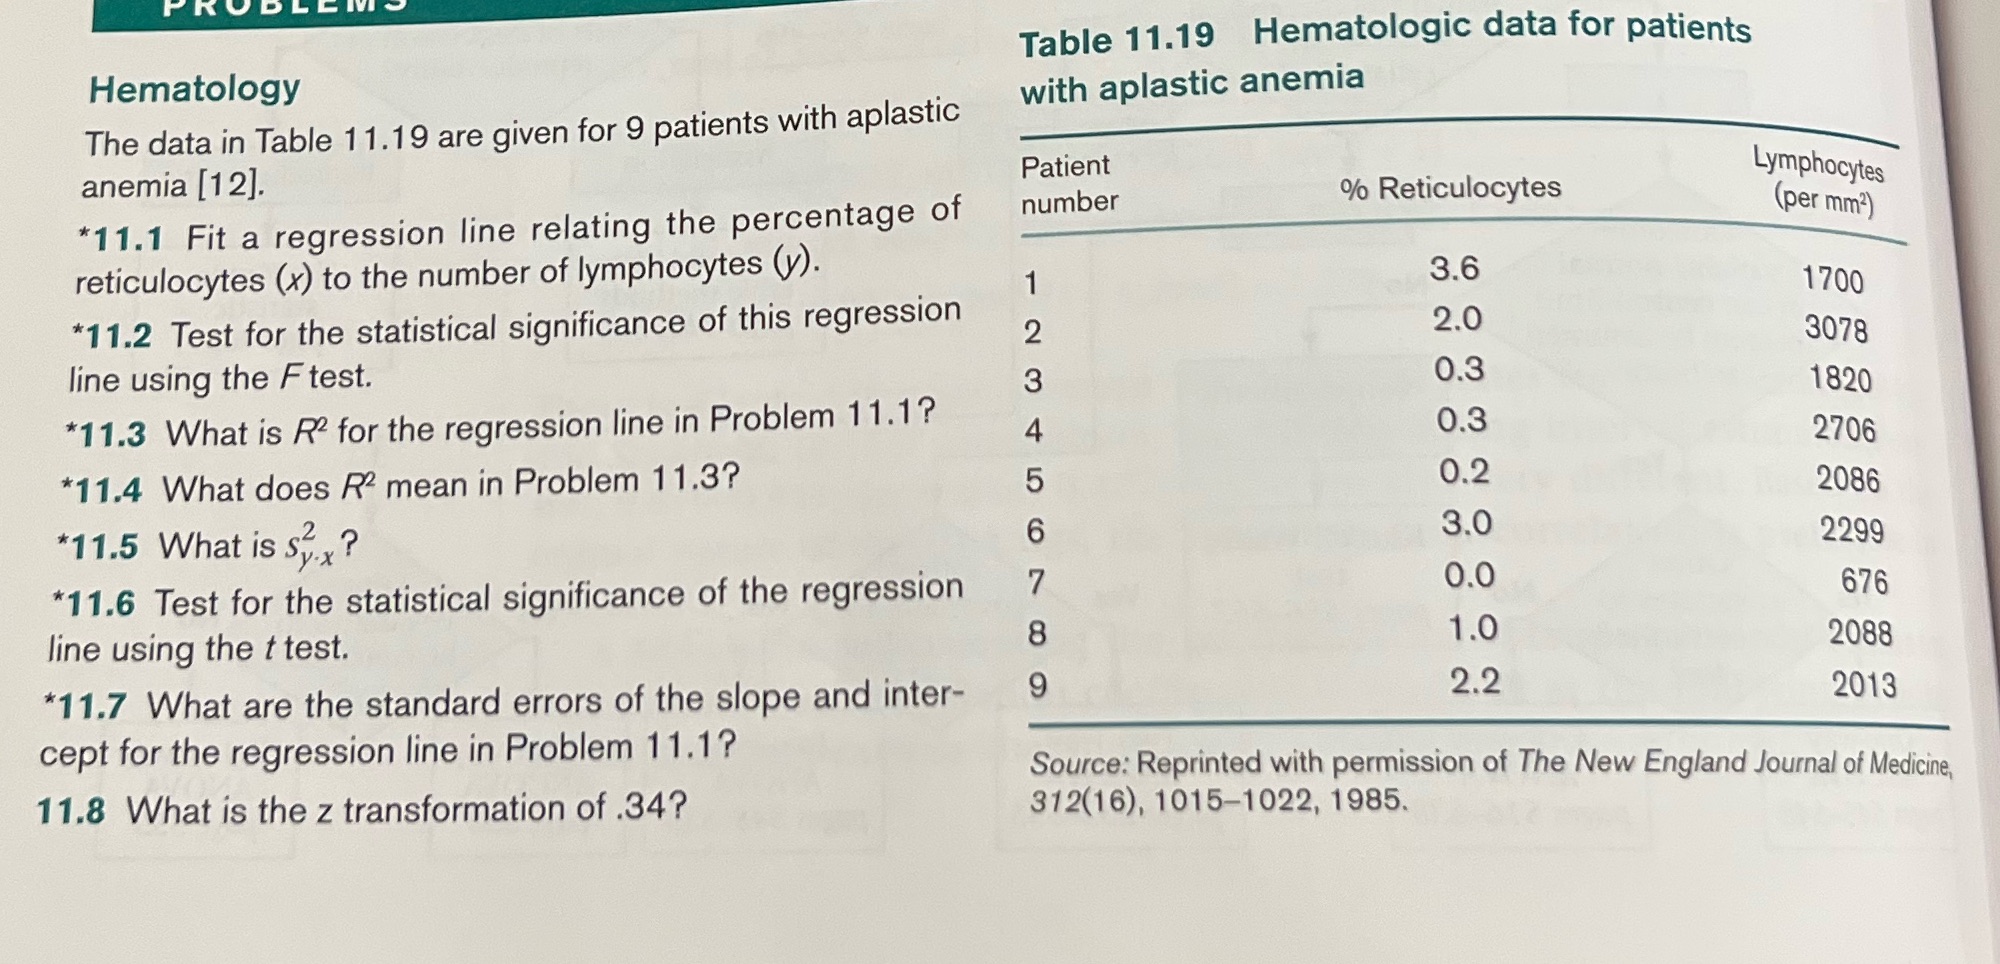
Table 11.19 Hematologic data for patients Hematology The data in Table 11.19 are given for 9 patients with aplastic anemia [12]. *11.1 Fit a regression line relating the percentage of reticulocytes (x) to the number of lymphocytes (y). *11.2 Test for the statistical significance of this regression line using the Ftest. Patient number with aplastic anemia % Reticulocytes Lymphocytes (per mm) 3.6 1 1700 2.0 2 3078 3 0.3 1820 *11.3 What is R2 for the regression line in Problem 11.1? *11.4 What does R mean in Problem 11.3? 4 0.3 2706 5 0.2 2086 *11.5 What is S.X? 6 3.0 2299 *11.6 Test for the statistical significance of the regression 0.0 676 8 1.0 2088 line using the t test. *11.7 What are the standard errors of the slope and inter- 9 2.2 2013 cept for the regression line in Problem 11.1? 11.8 What is the z transformation of .34? Source: Reprinted with permission of The New England Journal of Medicine, 312(16), 1015-1022, 1985.
Step by Step Solution
There are 3 Steps involved in it

Get step-by-step solutions from verified subject matter experts