

Question: Table 11.8 Blood-pressure variability measured at two points in time Person Between-visit Between-visit variance, year 1 variance, year 2 8.8 19.0 10.0 25.7 6.7 17.9
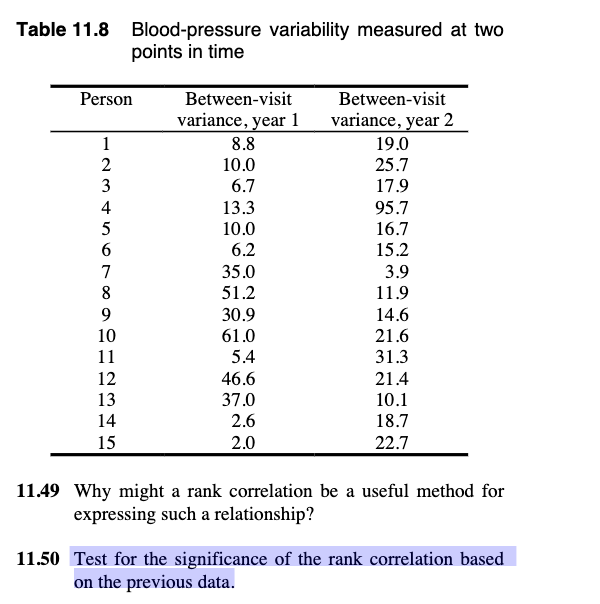
Table 11.8 Blood-pressure variability measured at two points in time Person Between-visit Between-visit variance, year 1 variance, year 2 8.8 19.0 10.0 25.7 6.7 17.9 13.3 95.7 10.0 16.7 6.2 15.2 35.0 3.9 51.2 11.9 30.9 14.6 61.0 21.6 5.4 31.3 46.6 21.4 37.0 10.1 2.6 18.7 15 2.0 22.7 11.49 Why might a rank correlation be a useful method for expressing such a relationship? 11.50 Test for the significance of the rank correlation based on the previous data
Step by Step Solution
There are 3 Steps involved in it
1 Expert Approved Answer
Step: 1 Unlock

Question Has Been Solved by an Expert!
Get step-by-step solutions from verified subject matter experts
Step: 2 Unlock
Step: 3 Unlock