

Question: Table 15.2 Functionality Matrix: Quality Tools Cause & Effect Check Control Design of Pareto Run Scatter Diagram Sheet Chart Experiments Five-5 FMEA Histogram Chart Chart
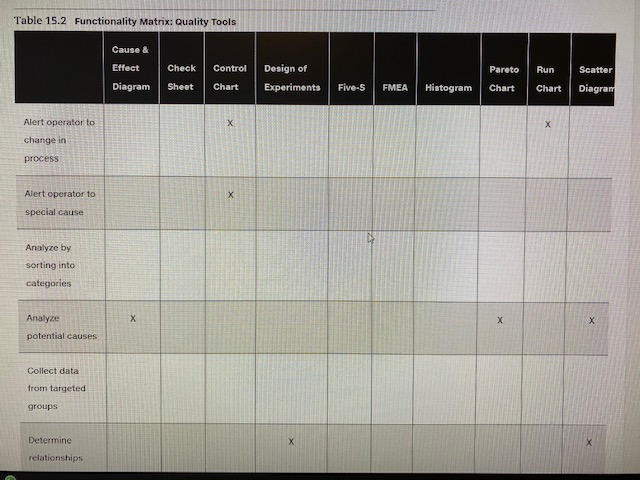
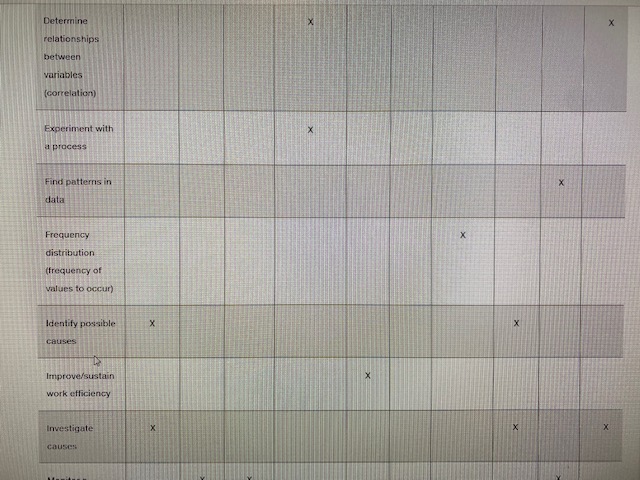
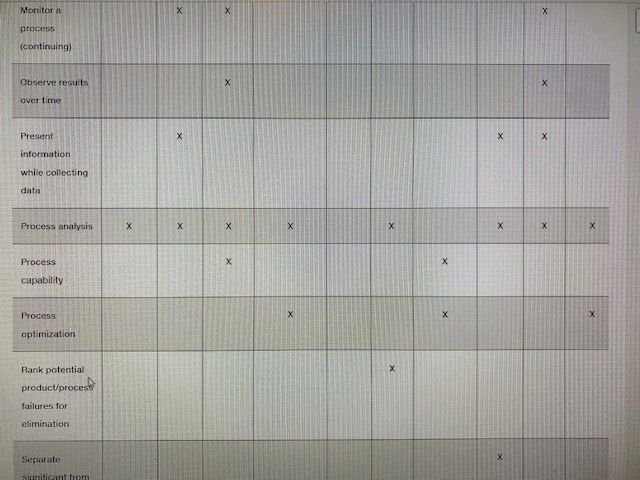
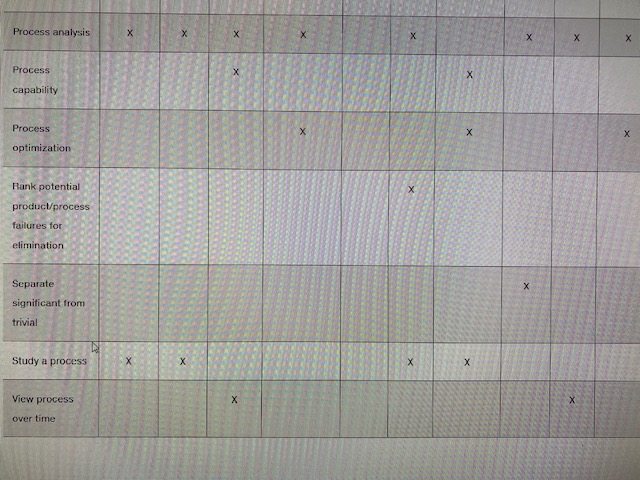
Table 15.2 Functionality Matrix: Quality Tools Cause & Effect Check Control Design of Pareto Run Scatter Diagram Sheet Chart Experiments Five-5 FMEA Histogram Chart Chart Diagram Alert operator to X X change in process Alert operator to special cause Analyze by sorting into categories Analyze X X X potential causes Collect data from targeted groups Determine X relationshipsDetermine X relationships between vanables [correlation) Experiment with process Find patterns in X data Frequency distribution (frequency of values to occur) Identify possible X X causes Improve/sustain work efficiency Investigate XMonitor a X (continuing) Observe results K over time X X X Present information while collecting data X X X X X X Process analysis Process X capability Process optimization Rank potential X product/process failures for elimination SeparateProcess analysis X X X X X X Process X capability Process X X optimization Hank potential product/process failures for elimination Separate significant from trivial X X X X Study a process View process X over time
Step by Step Solution
There are 3 Steps involved in it

Get step-by-step solutions from verified subject matter experts