

Question: Table 2 2. Using Excel or some other spreadsheet, make a graph of the 'Position of Each Leading Edge' versus the 'Time at Each Leading
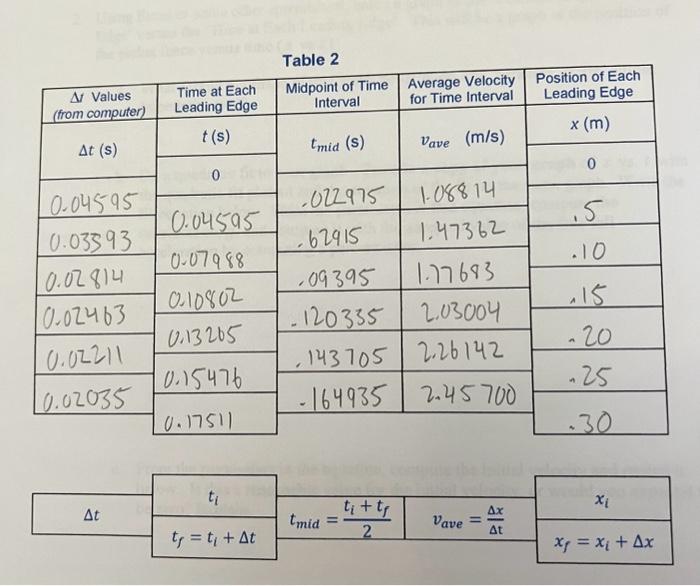
Table 2 2. Using Excel or some other spreadsheet, make a graph of the 'Position of Each Leading Edge' versus the 'Time at Each Leading Edge'. This will be a graph of the position of the picket fence versus time (x vs t ). a. What should the shape of this graph be (straight line, parabola, circle, ellipse, hyperbola, etc.)? b. Do a quadratic fit to your graph. Turn in a copy of your graph of x vs. t with the quadratic fit plotted and the equation of the fit on the same graph. Write the fit equation below. From the parameters in this equation, compute the acceleration, g, and compare it with the accepted value of the free-fall acceleration by computing a percent error. c. From the parameters in the equation, compute the initial velocity and record it below. Is this a reasonable value for the initial velocity, or would you expect it to be zero? Explain
Step by Step Solution
There are 3 Steps involved in it

Get step-by-step solutions from verified subject matter experts