

Question: Table 2 and table 3 Table 3 provides five years of monthly data (N=60) for NRVS and the related semi-fixed or mixed cost measures. Semifixed
Table 2 and table 3
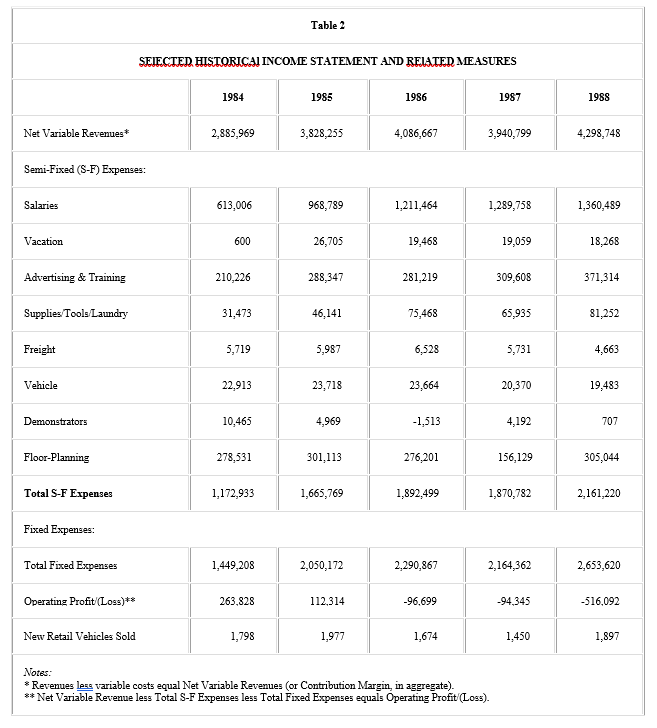
Table 3 provides five years of monthly data (N=60) for NRVS and the related semi-fixed or mixed cost measures. Semifixed costs were significant. Recall that they ranged from nearly $1.2 million for calendar and fiscal year (FY) 1984 to almost $2.2 million for FY 1988 (see Table 2).
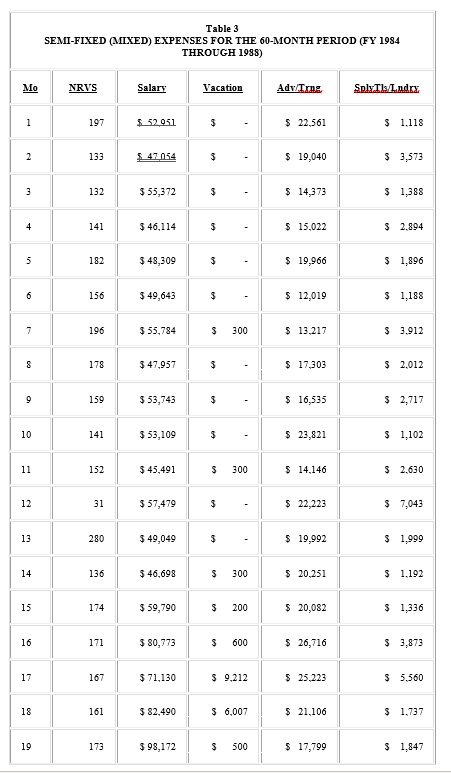
Notes: * Revenues leso variable costs equal Net Variable Revenues (or Contribution Margin, in aggregate). ** Net Variable Revenue less Total S-F Expenses less Total Fixed Expenses equals Operating Profit (Loss). Table 3 SEMI-FIXED (MIXED) EXPENSES FOR THE 60-MONTH PERIOD (FY 1984 THROUGH 1988) Notes: * Revenues leso variable costs equal Net Variable Revenues (or Contribution Margin, in aggregate). ** Net Variable Revenue less Total S-F Expenses less Total Fixed Expenses equals Operating Profit (Loss). Table 3 SEMI-FIXED (MIXED) EXPENSES FOR THE 60-MONTH PERIOD (FY 1984 THROUGH 1988)
Step by Step Solution
There are 3 Steps involved in it

Get step-by-step solutions from verified subject matter experts