

Question: Table 2 below contains data showing the response of two drainage basins ( or river catchments ) to identical storm events ( i . e
Table below contains data showing the response of two
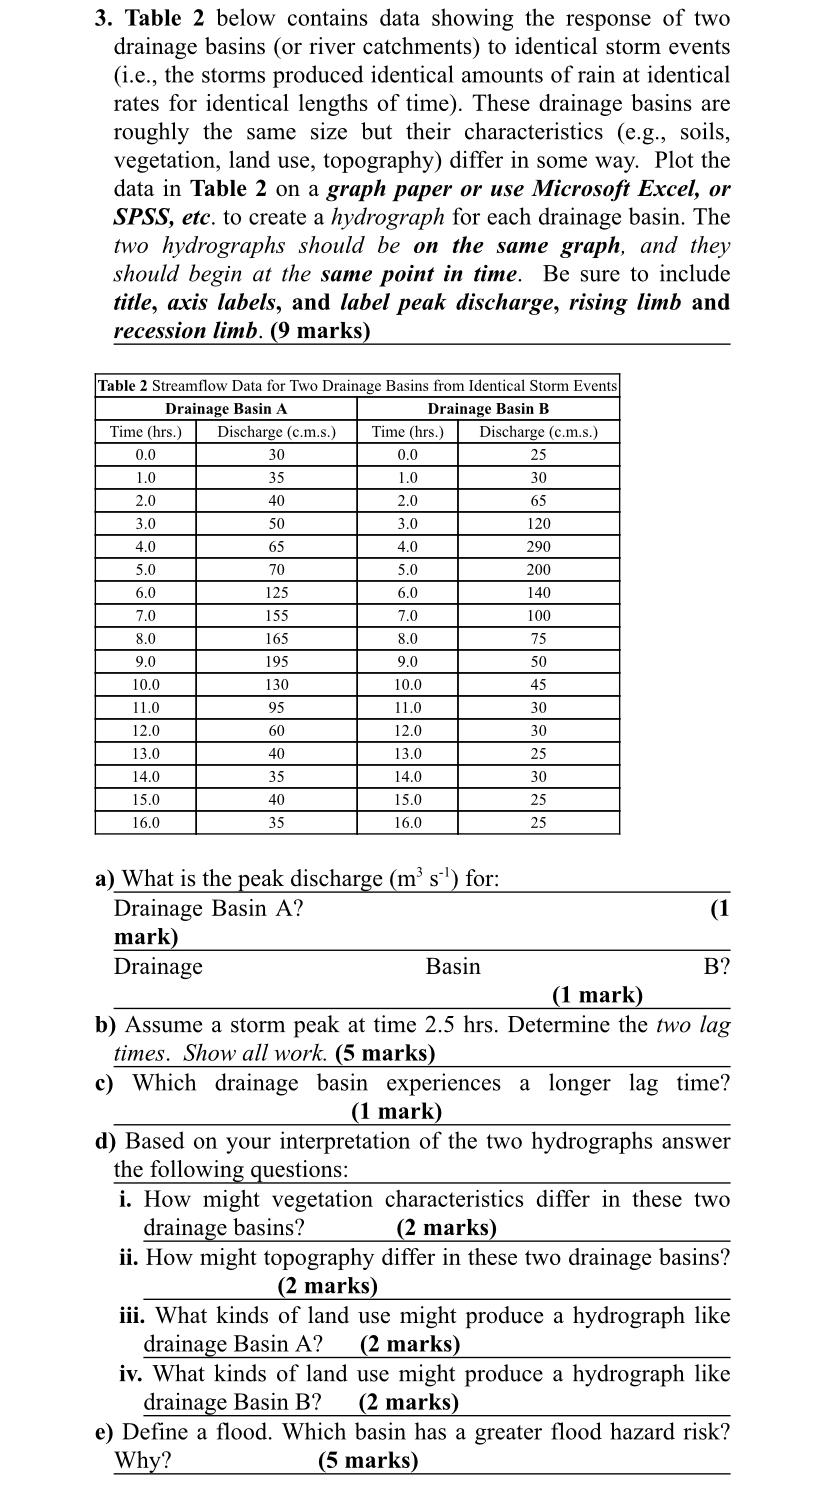
drainage basins or river catchments to identical storm events
ie the storms produced identical amounts of rain at identical
rates for identical lengths of time These drainage basins are
roughly the same size but their characteristics eg soils,
vegetation, land use, topography differ in some way. Plot the
data in Table on a graph paper or use Microsoft Excel, or
SPSS etc. to create a hydrograph for each drainage basin. The
two hydrographs should be on the same graph, and they
should begin at the same point in time. Be sure to include
title, axis labels, and label peak discharge, rising limb and
recession limb marks
a What is the peak discharge for:
Drainage Basin A
mark
mark
b Assume a storm peak at time Determine the two lag
times. Show all work. marks
c Which drainage basin experiences a longer lag time?
mark
d Based on your interpretation of the two hydrographs answer
the following questions:
i How might vegetation characteristics differ in these two
drainage basins?
marks
ii How might topography differ in these two drainage basins?
marks
iii. What kinds of land use might produce a hydrograph like
drainage Basin A marks
iv What kinds of land use might produce a hydrograph like
drainage Basin B marks
e Define a flood. Which basin has a greater flood hazard risk?
Why?
Step by Step Solution
There are 3 Steps involved in it
1 Expert Approved Answer
Step: 1 Unlock

Question Has Been Solved by an Expert!
Get step-by-step solutions from verified subject matter experts
Step: 2 Unlock
Step: 3 Unlock