

Question: Table 2 is a gene expression microarray data, where each row represents a sample for a person, each column represents a gene, and each entry
Table 2 is a gene expression microarray data, where each row represents a sample for a person, each column represents a gene, and each entry represents gene expression value. The output of each sample indicates whether a specific disease exists in this sample. Please use Manhattan Distance-Weighted KNN (K=3) to predict the output of the sample 11 and sample 12. Hint: you need to calculate the weights instead of simply count how many Yeses and Nos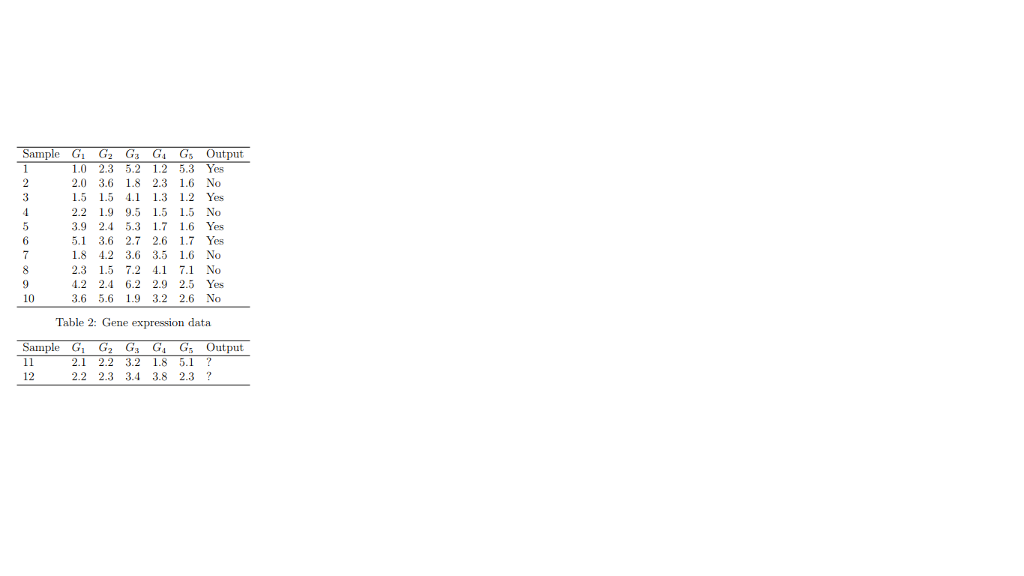
Samp Gi G2 Gs Ga Gs Output 1.0 2.3 5.2 1.2 5.3 Yes 2.0 3.6 18 2.3 1.6 No 5 15 1 13 1.2 Yes 2.2 1.9 9.5 15 15 No 3.9 2.4 5.3 17 1.6 Yes 51 3.6 2.7 2.6 1.7Yes 18 4.2 3.6 3.5 1.6 No 2.3 15 7.2 4.1 7.1 No .2 2.4 6.2 2.9 2.5 Yes 3.6 5.6 1.9 3.2 2.6 No 3 6 9 Table 2: Gene expression data 2 Gs G1 Gs Output 2.1 2.2 3.2 1.8 5.1 2.2 2.3 3.4 3.8 2.3 ? 12
Step by Step Solution
There are 3 Steps involved in it

Get step-by-step solutions from verified subject matter experts