

Question: Table 2. Ordinary Least Squares (OLS) Regression Models Predicting Second Exam Independent and Control Variables Model Model 2 Model 3 Model 5 Course type (online)
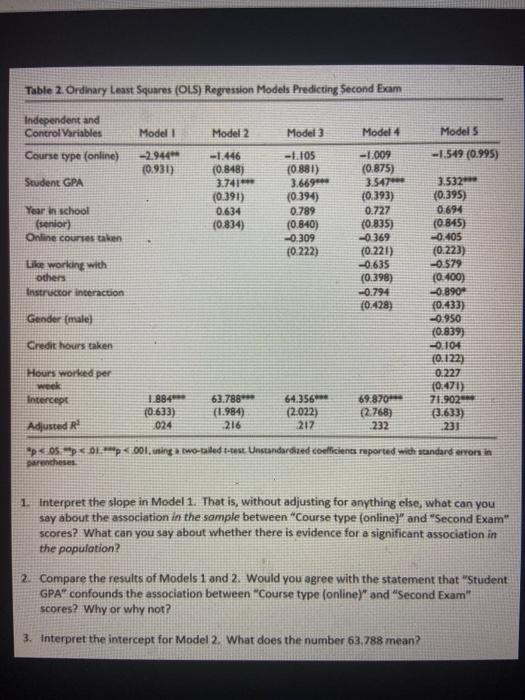
Table 2. Ordinary Least Squares (OLS) Regression Models Predicting Second Exam Independent and Control Variables Model Model 2 Model 3 Model 5 Course type (online) -1.549 (0.995) -2.944 (0.931) Student GPA -1.446 (0.848) 3.741 (0.391) 0.634 (0,834) -1.105 (0.881) 3.669 (0.394) 0.789 (0.840) -0.309 (0.222) Year in school (senior) Online courses taken Model 4 -1009 (0.875) 3.5474 (0.393) 0.727 (0.835) 0.369 (0.221) -0.635 (0.398) -0.794 (628) Like working with others Instructor interaction 3.5324 (0.395) 0.694 (0.845) -0.405 (0.223) -0.579 {0.400) - 8900 10.433) -0.950 (0.839) -0. 104 [0.122) 0.227 10,471) 71.902 (3.633) 231 Gender (male) Credit hours taken Hours worked per week Intercept 1.884012 (0:633) 024 63.788 (1.984) 216 64.356 (2.022) 217 69.8704 (2.268) 232 Adjusted P0p Dp001.wing two-walled test Unstandardized coeficients reported with standard errors in theses 1. Interpret the slope in Model 1. That is, without adjusting for anything else, what can you say about the association in the sample between "Course type (online)" and "Second Exam" scores? What can you say about whether there is evidence for a significant association in the population? 2. Compare the results of Models 1 and 2. Would you agree with the statement that "Student GPA" confounds the association between "Course type (online)" and "Second Exam scores? Why or why not? 3. Interpret the intercept for Model 2. What does the number 63.788 mean? Table 2. Ordinary Least Squares (OLS) Regression Models Predicting Second Exam Independent and Control Variables Model Model 2 Model 3 Model 5 Course type (online) -1.549 (0.995) -2.944 (0.931) Student GPA -1.446 (0.848) 3.741 (0.391) 0.634 (0,834) -1.105 (0.881) 3.669 (0.394) 0.789 (0.840) -0.309 (0.222) Year in school (senior) Online courses taken Model 4 -1009 (0.875) 3.5474 (0.393) 0.727 (0.835) 0.369 (0.221) -0.635 (0.398) -0.794 (628) Like working with others Instructor interaction 3.5324 (0.395) 0.694 (0.845) -0.405 (0.223) -0.579 {0.400) - 8900 10.433) -0.950 (0.839) -0. 104 [0.122) 0.227 10,471) 71.902 (3.633) 231 Gender (male) Credit hours taken Hours worked per week Intercept 1.884012 (0:633) 024 63.788 (1.984) 216 64.356 (2.022) 217 69.8704 (2.268) 232 Adjusted P0p Dp001.wing two-walled test Unstandardized coeficients reported with standard errors in theses 1. Interpret the slope in Model 1. That is, without adjusting for anything else, what can you say about the association in the sample between "Course type (online)" and "Second Exam" scores? What can you say about whether there is evidence for a significant association in the population? 2. Compare the results of Models 1 and 2. Would you agree with the statement that "Student GPA" confounds the association between "Course type (online)" and "Second Exam scores? Why or why not? 3. Interpret the intercept for Model 2. What does the number 63.788 mean
Step by Step Solution
There are 3 Steps involved in it

Get step-by-step solutions from verified subject matter experts