

Question: Table 2: Suppliers financial health evaluation sheet Complete for Task 3.1 Ratios LIQUIDITY Current ratio (Example) ACTIVITY Inventory turnover Fixed asset turnover Days sales
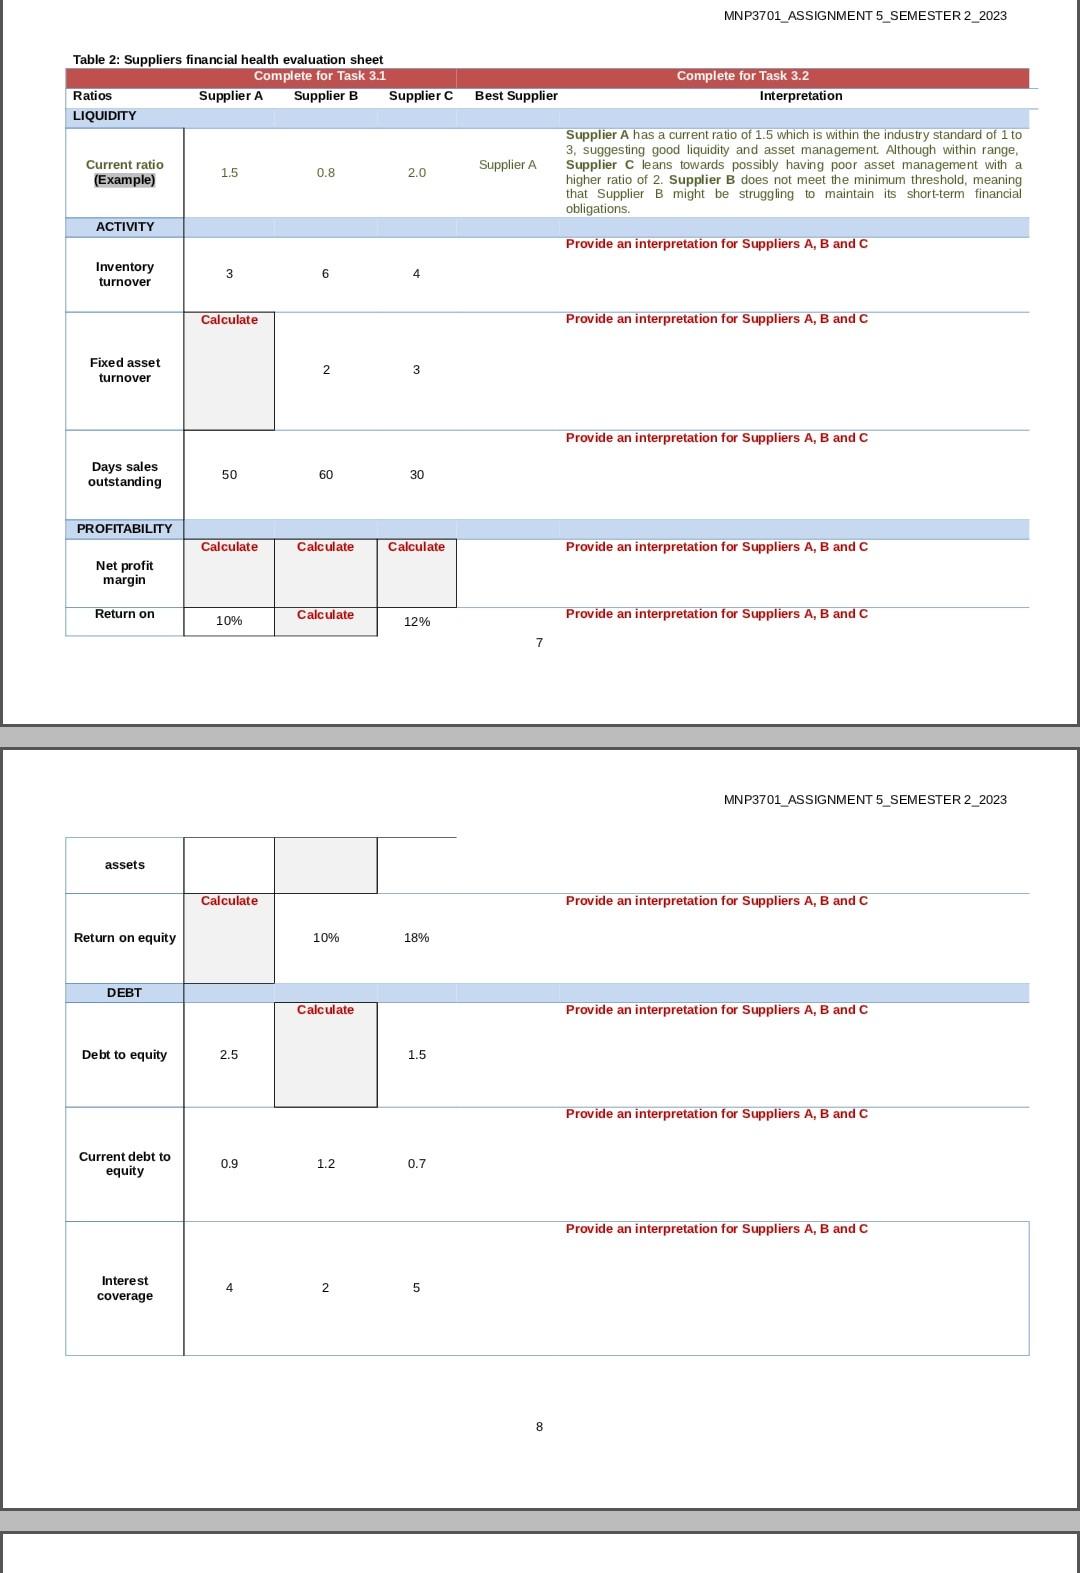
Table 2: Suppliers financial health evaluation sheet Complete for Task 3.1 Ratios LIQUIDITY Current ratio (Example) ACTIVITY Inventory turnover Fixed asset turnover Days sales outstanding PROFITABILITY Net profit margin Return on assets Return on equity DEBT Debt to equity Current debt to equity Interest coverage Supplier A Supplier B 1.5 3 Calculate 50 Calculate 10% Calculate 2.5 0.9 4 0.8 6 2 60 Calculate Calculate 10% Calculate 1.2 2 Supplier C 2.0 3 30 Calculate 12% 18% 1.5 0.7 5 Best Supplier Supplier A 7 8 MNP3701 ASSIGNMENT 5_SEMESTER 2_2023 Complete for Task 3.2 Interpretation Supplier A has a current ratio of 1.5 which is within the industry standard of 1 to 3, suggesting good liquidity and asset management. Although within range, Supplier C leans towards possibly having poor asset management with a higher ratio of 2. Supplier B does not meet the minimum threshold, meaning. that Supplier B might be struggling to maintain its short-term financial obligations. Provide an interpretation for Suppliers A, B and C Provide an interpretation for Suppliers A, B and C Provide an interpretation for Suppliers A, B and C Provide an interpretation for Suppliers A, B and C Provide an interpretation for Suppliers A, B and C MNP3701_ASSIGNMENT 5 SEMESTER 2_2023 Provide an interpretation for Suppliers A, B and C Provide an interpretation for Suppliers A, B and C Provide an interpretation for Suppliers A, B and C Provide an interpretation for Suppliers A, B and C
Step by Step Solution
3.29 Rating (143 Votes )
There are 3 Steps involved in it
a supplier financial health evaluation sheet Lets analyze the financial ratios for Supplier A B and C based on the information provided Liquidity Current Ratio Supplier A 15 is within the industry sta... View full answer

Get step-by-step solutions from verified subject matter experts