

Question: Table 2.10 shows the resistivity and TCR ( ? ) of Cu?Ni alloys. Plot TCR versus 1/ ? , and obtain the best-fit line. What
Table 2.10 shows the resistivity and TCR ( ? ) of Cu?Ni alloys. Plot TCR versus 1/ ? , and obtain the best-fit line. What is your conclusion? Consider the Matthiessen rule, and explain why the plot should be a straight line. What is the relationship between ? Cu, ? Cu, ? CuNi, and ? CuNi? Can this be generalized?
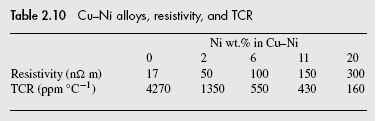
NOTE: ppm-parts per million, i.e., 10????-6.
Table 2.10 Cu-Ni alloys, resistivity, and TCR Resistivity (n52 m) TCR (ppm C-) 0 17 4270 Ni wt.% in Cu-Ni 6 2 50 1350 100 550 11 150 430 20 300 160
Step by Step Solution
3.43 Rating (172 Votes )
There are 3 Steps involved in it
To solve this problem lets proceed with the following steps Step 1 Understanding the Context TCR Tem... View full answer

Get step-by-step solutions from verified subject matter experts