

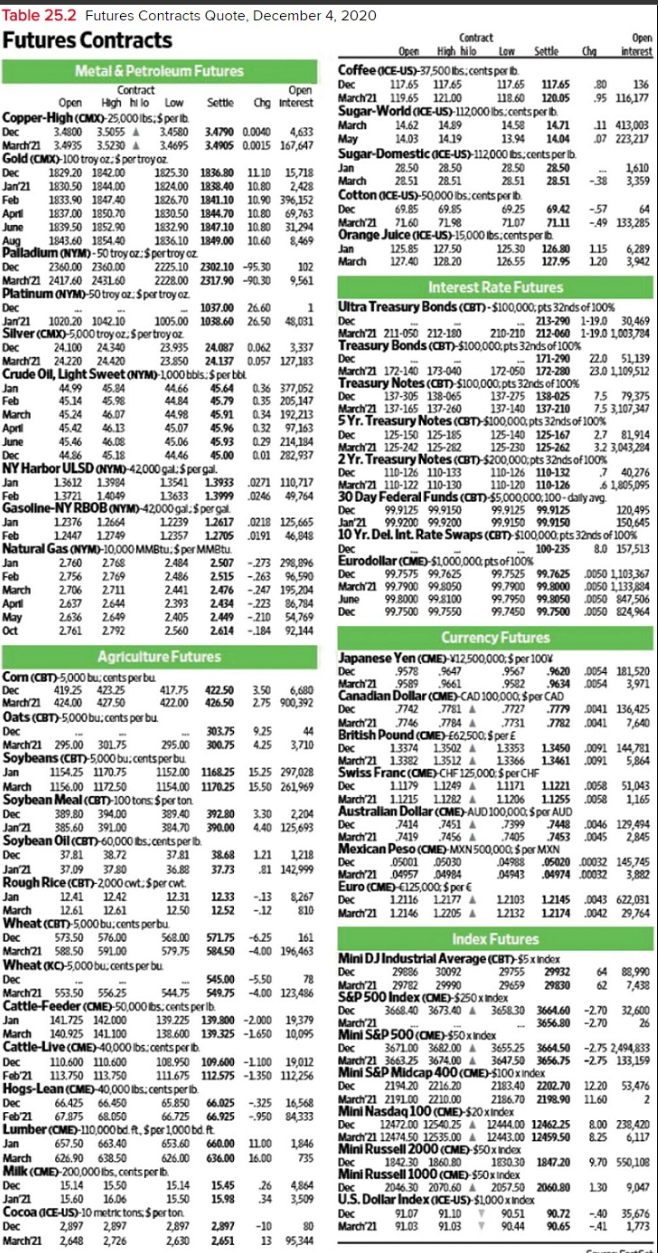
Table 25.2 Futures Contracts Quote, December 4, 2020 Futures Contracts Metal & Petroleum Futures Contract Open...
Fantastic news! We've Found the answer you've been seeking!
Question:
Transcribed Image Text:
Table 25.2 Futures Contracts Quote, December 4, 2020 Futures Contracts Metal & Petroleum Futures Contract Open High hilo Low Copper-High (CMX)-25,000 lbs:$per lb Dec 3.4800 3.5055 3.4580 March 21 3.4935 3.5230 A 3.4695 Gold (CMX)-100 troy oz: $ per troy oz Dec 1829.20 1842.00 April 1825.30 1836.80 1110 15,718 Jan 21 1830.50 1844.00 1824.00 1838.40 10.80 2,428 Feb 1833.90 1847.40 1826.70 1841.10 10.90 396,152 1837.00 1850.70 1830.50 1844.70 10.80 69,763 1839.50 1852.90 1832.90 1847.10 10.80 10.80 31,294 Aug 1843.60 1854.40 1836.10 1849.00 10.60 8,469 Palladium (NYM)-50 troy oz:$pertroy oz Dec June 2360.00 2360.00 March 21 2417.60 2431.60 Platinum (NYM)-50 troy oz: Sper troy oz. Dec 1 Jan 21 1020.20 1042.10 -1037.00 26.60 1005.00 1038.60 26.50 48,031 Silver (CMX)-5,000 troy oz: $ per troy oz. Dec 23.935 24.087 0.062 3,337 23.850 24.137 0.057 127,183 24.100 24.340 March 21 24.220 24.420 Crude Oil, Light Sweet (YM)-1000 bbls: $ per bbl Jan Feb March April June Dec Jan Feb 45.84 45.98 46.07 Jan Feb March April May Oct 44.99 45.14 45.24 45.42 46.13 45.46 46.08 44.86 45.18 NY Harbor ULSD ONYM)-42000 gal: $ pergal. Jan 13541 1.3933 Feb 1.3633 1.3999 Gasoline-NY RBOB (NYM)-42,000 gal:$pergal 1.3612 1.3984 1.3721 1.4049 12376 1.2664 1.2447 1.2749 1.2239 1.2357 1.2705 Natural Gas (NYM)-10,000 MMBtu:$per MMBtu. 2.760 2768 2.756 2.769 2.706 2711 2.637 2644 2.636 2.649 2.761 2792 2225.10 2302.10 -95.30 2228.00 2317.90 -90.30 Corn (CBT)-5,000 bu; cents per bu Dec 419.25 423.25 March 21 424.00 427.50 Oats (CBT)-5,000 bu; cents per bu Dec 44.66 45.64 0.36 377,052 45.79 0.35 205,147 44.84 44.98 45.07 45.91 0.34 192,213 45.96 0.32 97,163 45.06 45.93 0.29 214,184 44.46 45.00 0.01 282,937 2.484 2.486 2.441 2.393 2.405 2.560 15.14 15.50 15.60 16.06 Open Settle Chg Interest 417.75 422.00 March21 295.00 301.75 295.00 Soybeans (CBT)-5,000 bu:cents per bu 1152.00 3.4790 0.0040 4,633 3.4905 0.0015 167,647 Agriculture Futures Jan 1154.25 1170.75 1154.00 March 1156.00 1172.50 Soybean Meal (CBT)-100 tons: $ per ton Dec 389.80 394.00 Jan 21 385.60 391.00 Soybean Oil (CBT)-60,000 lbs, cents per lb. Dec 37.81 38.72 37.81 Jan 21 37.09 37.80 36.88 Rough Rice (CBT)-2000 cwt:$per cwt. Jan 12.41 12.42 12.31 March 12.61 12.61 12.50 Wheat (CBT)-5,000 bu; cents perbu Dec 573.50 576.00 March21 588.50 591.00 Wheat (KC)-5,000 bu; cents per bu 1.2617 0218 125,665 0191 46,848 102 9,561 2.507 -273 298,896 2.515 -263 96,590 2.476 -247 195,204 2.434 -223 86,784 2.449 -210 54,769 2.614 -184 92,144 389.40 392.80 384.70 390.00 15.14 15.50 0271 110,717 0246 49,764 422.50 3.50 6,680 426.50 2.75 900,392 2,897 2,630 303.75 9.25 44 300.75 4.25 3,710 1168.25 15.25 297,028 1170.25 15.50 261,969 38.68 37.73 Dec March21 553.50 556.25 544.75 Cattle-Feeder (CME)-50,000 lbs. cents per lb. 141725 142.000 Jan March 140.925 141.100 Cattle-Live (CME)-40,000 lbs: cents perib Dec 110.600 110.600 Feb 21 113.750 113.750 Hogs-Lean (CME)-40,000 lbs; cents per lb. Dec 66.425 66.450 Feb 21 67.875 68.050 Lumber (CME)-110,000 bd. ft, $per 1,000 bd. ft. Jan 657.50 663.40 March 626.90 638.50 Milk (CME)-200,000 lbs, cents per b Dec Jan 21 Cocoa (ICE-US)-10 metric tons, $perton Dec 2,897 2,897 March21 2,648 2,726 3.30 2,204 4.40 125,693 568.00 571.75 -6.25 161 579.75 584.50 -4.00 196,463 1.21 1,218 81 142,999 12.33 -.13 8,267 12.52 -.12 810 545.00 -5.50 78 549.75 -4.00 123,486 139.225 139.800 -2.000 19,379 138.600 139.325 -1.650 10,095 108.950 109.600 -1100 19,012 111.675 112.575 -1.350 112,256 65.850 66.025 -325 16,568 66.725 66.925 -.950 84,333 653.60 660.00 11.00 1,846 626.00 636.00 16.00 735 15.45 26 4,864 15.98 34 3,509 2,897 -10 80 2,651 13 95,344 Contract Open High hilo Low Settle Cha Coffee (CE-US)-37,500 lbs, cents per b 117.65 117.65 Dec March21 119.65 121.00 117.65 117.65 118.60 120.05 Sugar-World (ICE-US)-112,000 lbs. cents per b March 14.62 14.89 May 14.03 14.19 14.58 1471 13.94 14.04 Sugar-Domestic (ICE-US)-112,000 lbs,cents per lb. 28.50 28.50 28.51 28.51 28.50 28.50 28.51 28.51 Open interest .80 136 95 116,177 11 413,003 07 223,217 Jan March 69.25 69.42 71.07 71.11 Cotton (ICE-US)-50,000 lbs: cents per b Dec 69.85 69.85 March 21 71.60 71.60 71.98 Orange Juice (ICE-US)-15,000 lbs:cents per b Jan 125.85 127.50 March 127.40 128.20 125.30 126.80 115 6,289 126.55 127.95 1.20 3,942 -38 1,610 3,359 64 -49 133,285 Interest Rate Futures Ultra Treasury Bonds (CBT)-$100,000; pts 32nds of 100% Dec 213-290 1-19.0 30,469 March 21 211-050 212-180 210-210 212-060 1-19.0 1,003,784 Treasury Bonds (CBT)-$100,000.pts 32nds of 100% Dec March 21 172-140 173-040 171-290 172-050 172-280 Treasury Notes (CBT) $100,000. pts 32nds of 100% 137-305 138-065 Dec March 21 137-165 137-260 137-275 138-025 137-140 137-210 5Yr. Treasury Notes (CBT)-$100,000; pts 32nds of 100% 22.0 51,139 23.0 1.109512 75 79,375 7.5 3,107,347 Dec 125-150 125-185 March21 125-242 125-282 2 Yr. Treasury Notes (CBT)-$200,000;pts 32nds of 100% 125-140 125-167 125-230 125-262 110-126 110-132 Dec 110-126 110-133 March 21 110-122 110-130 110-120 110-126 30 Day Federal Funds (CBT)-$5,000,000, 100-daily avg Dec 99.9125 99.9150 Jan 21 99.9200 99.9200 99.9125 99.9125 120,495 150,645 99.9150 99.9150 10 Yr. Del. Int. Rate Swaps (CBT) $100,000 pts 32nds of 100% Dec 8.0 157,513 Eurodollar (CME)-$1,000,000 pts of 100% -100-235 Dec 99.7575 99.7625 March 21 99.7900 99.8050 June 99.8000 99.8100 Dec 99.7500 99.7550 99.7525 99.7625 0050 1,103,367 99.7900 99.8000 0050 1,133,894 99.7950 99.8050 0050 847,506 99.7450 99.7500 .0050 824,964 2.7 81,914 3.2 3,043,294 7 40,276 6 1,805,095 Currency Futures Japanese Yen (CME)-X12,500,000;$per 100% .9578 9647 .9567 9620 0054 181,520 .9582 .9634 0054 3,971 7727 7779 0041 136,425 7731 7782 0041 7,640 Dec March 21 9589 .9661 Canadian Dollar (CME)-CAD 100,000, $per CAD Dec 7742 7781 A March 21 7746 7784 A British Pound (CME)-£62,500, $per E Dec 1.3374 1.3502 A 13353 1.3450 0091 144,781 March 21 1.3382 1.3512 A 13366 13461 .0091 5,864 Swiss Franc (CME) CHF 125,000: $ per CHF Dec 1.1179 1.1249 A 11171 11221 0058 51,043 March 21 1.1215 1.1282 A 11206 1.1255 .0058 1,165 Australian Dollar (CME)-AUD 100,000; $por AUD Dec 7414 7451 7399 7448 0046 129,494 March 21 7419 7456 A 7405 7453 0045 2,845 Mexican Peso (CME)-MXN 500,000 $per MXN Dec 05001 05030 04988 05020 .00032 145,745 March 21 04957 04984 04943 .04974 00032 3,882 Euro (CME)-€125,000 $per € Dec 1.2116 12177 A March 21 12146 1.2205 A 12103 1.2145 0043 622,031 12132 1.2174 0042 29,764 Index Futures Mini DJ Industrial Average (CBT)-$5x Index Dec 29886 30092 March 21 29782 29990 S&P 500 Index (CME)-$250x Index Dec 3668.40 3673.40 A 3658.30 March 21 Mini S&P 500 (CME)-$50x Index Dec 3671.00 3682.00 A 3655.25 3664.50 -2.75 2,494,833 March 21 3663.25 3674.00 A 3647.50 3656.75 -2.75 133,159 Mini S&P Midcap 400 (CME)-$100x Index Dec 2194.20 2216.20 March 21 2191.00 2210.00 Mini Nasdaq 100 (CME)-$20xIndex Dec 12472.00 12540.25 A 12444.00 12462.25 March 21 12474.50 12535.00 A 12443.00 12459.50 Mini Russell 2000 (CME)-$50x Index Dec 1842.30 1860.80 1830.30 1847.20 Mini Russell 1000 (CME)-$50x Index Dec 2046.30 2070.60 2057.50 2060.80 A U.S. Dollar Index (ICE-US) $1000x Index Dec 91.07 91.10 ▼ 90.51 90.72 -40 35,676 March 21 91.03 91.03 Y 90.44 90.65 -41 1,773 29755 29932 64 88,990 29659 29830 62 7,438 3664.60 -2.70 32,600 3656.80 -2.70 26 2183.40 2202.70 12.20 53,476 2186.70 2198.90 11.60 2 8.00 238,420 8.25 6,117 9.70 550,108 1.30 9,047 F Suppose you sell ten March 2021 silver futures contracts on December 4, 2020, at the last price of the day. Use Table 25.2. a. What will your profit or loss be if silver prices turn out to be $25.19 per ounce at expiration? (Enter your answer as a positive value. Do not round intermediate calculations and round your answer to the nearest whole number, e.g., 32.) b. What will your profit or loss be if silver prices are $23.40 per ounce at expiration? (Enter your answer as a positive value. Do not round intermediate calculations and round your answer to the nearest whole number, e.g., 32.) a. Net loss b. Net gain Table 25.2 Futures Contracts Quote, December 4, 2020 Futures Contracts Metal & Petroleum Futures Contract Open High hilo Low Copper-High (CMX)-25,000 lbs:$per lb Dec 3.4800 3.5055 3.4580 March 21 3.4935 3.5230 A 3.4695 Gold (CMX)-100 troy oz: $ per troy oz Dec 1829.20 1842.00 April 1825.30 1836.80 1110 15,718 Jan 21 1830.50 1844.00 1824.00 1838.40 10.80 2,428 Feb 1833.90 1847.40 1826.70 1841.10 10.90 396,152 1837.00 1850.70 1830.50 1844.70 10.80 69,763 1839.50 1852.90 1832.90 1847.10 10.80 10.80 31,294 Aug 1843.60 1854.40 1836.10 1849.00 10.60 8,469 Palladium (NYM)-50 troy oz:$pertroy oz Dec June 2360.00 2360.00 March 21 2417.60 2431.60 Platinum (NYM)-50 troy oz: Sper troy oz. Dec 1 Jan 21 1020.20 1042.10 -1037.00 26.60 1005.00 1038.60 26.50 48,031 Silver (CMX)-5,000 troy oz: $ per troy oz. Dec 23.935 24.087 0.062 3,337 23.850 24.137 0.057 127,183 24.100 24.340 March 21 24.220 24.420 Crude Oil, Light Sweet (YM)-1000 bbls: $ per bbl Jan Feb March April June Dec Jan Feb 45.84 45.98 46.07 Jan Feb March April May Oct 44.99 45.14 45.24 45.42 46.13 45.46 46.08 44.86 45.18 NY Harbor ULSD ONYM)-42000 gal: $ pergal. Jan 13541 1.3933 Feb 1.3633 1.3999 Gasoline-NY RBOB (NYM)-42,000 gal:$pergal 1.3612 1.3984 1.3721 1.4049 12376 1.2664 1.2447 1.2749 1.2239 1.2357 1.2705 Natural Gas (NYM)-10,000 MMBtu:$per MMBtu. 2.760 2768 2.756 2.769 2.706 2711 2.637 2644 2.636 2.649 2.761 2792 2225.10 2302.10 -95.30 2228.00 2317.90 -90.30 Corn (CBT)-5,000 bu; cents per bu Dec 419.25 423.25 March 21 424.00 427.50 Oats (CBT)-5,000 bu; cents per bu Dec 44.66 45.64 0.36 377,052 45.79 0.35 205,147 44.84 44.98 45.07 45.91 0.34 192,213 45.96 0.32 97,163 45.06 45.93 0.29 214,184 44.46 45.00 0.01 282,937 2.484 2.486 2.441 2.393 2.405 2.560 15.14 15.50 15.60 16.06 Open Settle Chg Interest 417.75 422.00 March21 295.00 301.75 295.00 Soybeans (CBT)-5,000 bu:cents per bu 1152.00 3.4790 0.0040 4,633 3.4905 0.0015 167,647 Agriculture Futures Jan 1154.25 1170.75 1154.00 March 1156.00 1172.50 Soybean Meal (CBT)-100 tons: $ per ton Dec 389.80 394.00 Jan 21 385.60 391.00 Soybean Oil (CBT)-60,000 lbs, cents per lb. Dec 37.81 38.72 37.81 Jan 21 37.09 37.80 36.88 Rough Rice (CBT)-2000 cwt:$per cwt. Jan 12.41 12.42 12.31 March 12.61 12.61 12.50 Wheat (CBT)-5,000 bu; cents perbu Dec 573.50 576.00 March21 588.50 591.00 Wheat (KC)-5,000 bu; cents per bu 1.2617 0218 125,665 0191 46,848 102 9,561 2.507 -273 298,896 2.515 -263 96,590 2.476 -247 195,204 2.434 -223 86,784 2.449 -210 54,769 2.614 -184 92,144 389.40 392.80 384.70 390.00 15.14 15.50 0271 110,717 0246 49,764 422.50 3.50 6,680 426.50 2.75 900,392 2,897 2,630 303.75 9.25 44 300.75 4.25 3,710 1168.25 15.25 297,028 1170.25 15.50 261,969 38.68 37.73 Dec March21 553.50 556.25 544.75 Cattle-Feeder (CME)-50,000 lbs. cents per lb. 141725 142.000 Jan March 140.925 141.100 Cattle-Live (CME)-40,000 lbs: cents perib Dec 110.600 110.600 Feb 21 113.750 113.750 Hogs-Lean (CME)-40,000 lbs; cents per lb. Dec 66.425 66.450 Feb 21 67.875 68.050 Lumber (CME)-110,000 bd. ft, $per 1,000 bd. ft. Jan 657.50 663.40 March 626.90 638.50 Milk (CME)-200,000 lbs, cents per b Dec Jan 21 Cocoa (ICE-US)-10 metric tons, $perton Dec 2,897 2,897 March21 2,648 2,726 3.30 2,204 4.40 125,693 568.00 571.75 -6.25 161 579.75 584.50 -4.00 196,463 1.21 1,218 81 142,999 12.33 -.13 8,267 12.52 -.12 810 545.00 -5.50 78 549.75 -4.00 123,486 139.225 139.800 -2.000 19,379 138.600 139.325 -1.650 10,095 108.950 109.600 -1100 19,012 111.675 112.575 -1.350 112,256 65.850 66.025 -325 16,568 66.725 66.925 -.950 84,333 653.60 660.00 11.00 1,846 626.00 636.00 16.00 735 15.45 26 4,864 15.98 34 3,509 2,897 -10 80 2,651 13 95,344 Contract Open High hilo Low Settle Cha Coffee (CE-US)-37,500 lbs, cents per b 117.65 117.65 Dec March21 119.65 121.00 117.65 117.65 118.60 120.05 Sugar-World (ICE-US)-112,000 lbs. cents per b March 14.62 14.89 May 14.03 14.19 14.58 1471 13.94 14.04 Sugar-Domestic (ICE-US)-112,000 lbs,cents per lb. 28.50 28.50 28.51 28.51 28.50 28.50 28.51 28.51 Open interest .80 136 95 116,177 11 413,003 07 223,217 Jan March 69.25 69.42 71.07 71.11 Cotton (ICE-US)-50,000 lbs: cents per b Dec 69.85 69.85 March 21 71.60 71.60 71.98 Orange Juice (ICE-US)-15,000 lbs:cents per b Jan 125.85 127.50 March 127.40 128.20 125.30 126.80 115 6,289 126.55 127.95 1.20 3,942 -38 1,610 3,359 64 -49 133,285 Interest Rate Futures Ultra Treasury Bonds (CBT)-$100,000; pts 32nds of 100% Dec 213-290 1-19.0 30,469 March 21 211-050 212-180 210-210 212-060 1-19.0 1,003,784 Treasury Bonds (CBT)-$100,000.pts 32nds of 100% Dec March 21 172-140 173-040 171-290 172-050 172-280 Treasury Notes (CBT) $100,000. pts 32nds of 100% 137-305 138-065 Dec March 21 137-165 137-260 137-275 138-025 137-140 137-210 5Yr. Treasury Notes (CBT)-$100,000; pts 32nds of 100% 22.0 51,139 23.0 1.109512 75 79,375 7.5 3,107,347 Dec 125-150 125-185 March21 125-242 125-282 2 Yr. Treasury Notes (CBT)-$200,000;pts 32nds of 100% 125-140 125-167 125-230 125-262 110-126 110-132 Dec 110-126 110-133 March 21 110-122 110-130 110-120 110-126 30 Day Federal Funds (CBT)-$5,000,000, 100-daily avg Dec 99.9125 99.9150 Jan 21 99.9200 99.9200 99.9125 99.9125 120,495 150,645 99.9150 99.9150 10 Yr. Del. Int. Rate Swaps (CBT) $100,000 pts 32nds of 100% Dec 8.0 157,513 Eurodollar (CME)-$1,000,000 pts of 100% -100-235 Dec 99.7575 99.7625 March 21 99.7900 99.8050 June 99.8000 99.8100 Dec 99.7500 99.7550 99.7525 99.7625 0050 1,103,367 99.7900 99.8000 0050 1,133,894 99.7950 99.8050 0050 847,506 99.7450 99.7500 .0050 824,964 2.7 81,914 3.2 3,043,294 7 40,276 6 1,805,095 Currency Futures Japanese Yen (CME)-X12,500,000;$per 100% .9578 9647 .9567 9620 0054 181,520 .9582 .9634 0054 3,971 7727 7779 0041 136,425 7731 7782 0041 7,640 Dec March 21 9589 .9661 Canadian Dollar (CME)-CAD 100,000, $per CAD Dec 7742 7781 A March 21 7746 7784 A British Pound (CME)-£62,500, $per E Dec 1.3374 1.3502 A 13353 1.3450 0091 144,781 March 21 1.3382 1.3512 A 13366 13461 .0091 5,864 Swiss Franc (CME) CHF 125,000: $ per CHF Dec 1.1179 1.1249 A 11171 11221 0058 51,043 March 21 1.1215 1.1282 A 11206 1.1255 .0058 1,165 Australian Dollar (CME)-AUD 100,000; $por AUD Dec 7414 7451 7399 7448 0046 129,494 March 21 7419 7456 A 7405 7453 0045 2,845 Mexican Peso (CME)-MXN 500,000 $per MXN Dec 05001 05030 04988 05020 .00032 145,745 March 21 04957 04984 04943 .04974 00032 3,882 Euro (CME)-€125,000 $per € Dec 1.2116 12177 A March 21 12146 1.2205 A 12103 1.2145 0043 622,031 12132 1.2174 0042 29,764 Index Futures Mini DJ Industrial Average (CBT)-$5x Index Dec 29886 30092 March 21 29782 29990 S&P 500 Index (CME)-$250x Index Dec 3668.40 3673.40 A 3658.30 March 21 Mini S&P 500 (CME)-$50x Index Dec 3671.00 3682.00 A 3655.25 3664.50 -2.75 2,494,833 March 21 3663.25 3674.00 A 3647.50 3656.75 -2.75 133,159 Mini S&P Midcap 400 (CME)-$100x Index Dec 2194.20 2216.20 March 21 2191.00 2210.00 Mini Nasdaq 100 (CME)-$20xIndex Dec 12472.00 12540.25 A 12444.00 12462.25 March 21 12474.50 12535.00 A 12443.00 12459.50 Mini Russell 2000 (CME)-$50x Index Dec 1842.30 1860.80 1830.30 1847.20 Mini Russell 1000 (CME)-$50x Index Dec 2046.30 2070.60 2057.50 2060.80 A U.S. Dollar Index (ICE-US) $1000x Index Dec 91.07 91.10 ▼ 90.51 90.72 -40 35,676 March 21 91.03 91.03 Y 90.44 90.65 -41 1,773 29755 29932 64 88,990 29659 29830 62 7,438 3664.60 -2.70 32,600 3656.80 -2.70 26 2183.40 2202.70 12.20 53,476 2186.70 2198.90 11.60 2 8.00 238,420 8.25 6,117 9.70 550,108 1.30 9,047 F Suppose you sell ten March 2021 silver futures contracts on December 4, 2020, at the last price of the day. Use Table 25.2. a. What will your profit or loss be if silver prices turn out to be $25.19 per ounce at expiration? (Enter your answer as a positive value. Do not round intermediate calculations and round your answer to the nearest whole number, e.g., 32.) b. What will your profit or loss be if silver prices are $23.40 per ounce at expiration? (Enter your answer as a positive value. Do not round intermediate calculations and round your answer to the nearest whole number, e.g., 32.) a. Net loss b. Net gain
Expert Answer:
Answer rating: 100% (QA)
Okay lets solve this stepbystep a ProfitLoss if silver prices are 2519 per ounce at expiration The ... View the full answer

Related Book For 
Corporate Finance
ISBN: 9781265533199
13th International Edition
Authors: Stephen Ross, Randolph Westerfield, Jeffrey Jaffe
Posted Date:
Students also viewed these finance questions
-
Refer to Table 25.2 in the text to answer this question. Suppose today is December 4, 2020, and your firm produces breakfast cereal and needs 180,000 bushels of corn in March 2021 for an upcoming...
-
Refer to Table 25.2 in the text to answer this question. Suppose you sell five March 2021 silver futures contracts on December 4, 2020, at the last price of the day. What will your profit or loss be...
-
an unadjusted trial balance as of December 31, 2020. (6points)Account TitleBalanceDebitCreditCash36,910Accounts Receivable5,750Office Supplies1,400 PART1: The following transactions occurred for...
-
Refer to the Arctic Springs Filtration Department Data Set and your answer to S5-16. 1. Record the journal entry to transfer the cost of the 160,000 liters completed and transferred out of the...
-
Concealment is the covering of tracks, obscuring of evidence, and removal of red flags to hide a perpetrators fraud. (True/False)
-
Imagine at the next FOMC meeting, governors and voting presidents of the Federal Reserve System agree not to increase the federal funds rate target, but suggest to markets that there could be an...
-
AMR, parent of American Airlines, provides the following footnote information on its capital and operating leases: AMRs subsidiaries lease various types of equipment and property, primarily aircraft...
-
Reliability and validity are cornerstone concepts in quantitative research, while credibility plays a similar foundational role in qualitative research. Understanding these concepts helps to assess...
-
Ramakrishnan Inc. reported 2024 net income of $15 million and depreciation of $2,650,000. The top part of Ramakrishnan, Inc.s 2024 and 2023 balance sheets is listed below (in millions of dollars)....
-
6. Which of the following are functions of bearings? (a) Ensure free rotation of shaft with minimum friction (b) Holding shaft in a correct position (c) Transmit the force of the shaft to the frame...
-
Prove the following: 11 fi = fn+2 -1 i=1
-
Renegade Sports have issued 5 year bonds to raise capital for expansion into new markets. The bonds pay coupons annually at an effective annual rate of 10% pa. The face amount of the bonds is...
-
A 40 gallon electric water heater is used to heat tap water 10C. The heating level is set to the maximum level while several people take consecutive showers. If, at the maximum heating level, the...
-
Equity: 120,000 shares at $1 each. Share premium: $22,000 The company decides to issue 1:3 shares. Nominal value is $1 and price is $2.5. How many shares does the company issue? How much does the...
-
What is the difference between qualitative and quantitative analysis. Explain with the help of examples.
-
Luckin Coffee Inc. has agreed to pay $180 million to settle regulatory claims that it cooked its books to make growth appear more robust and meet earnings targets. The Securities and Exchange...
-
One Way Cellular accountants have assembled the following data for the year ended September 30, 2014: Prepare the operating activities section using the indirect method for One Way Cellulars...
-
U.S. Composite Corporation is attempting to increase its line of credit with First National State Bank. The director of credit management of First National State Bank uses the Z-score model to...
-
Changes in the Cash Account indicate the impact of the following corporate actions on cash, using the letter I for an increase, D for a decrease, or N when no change occurs: a. A dividend is paid...
-
What is the impact of an increase in the volatility of the underlying stock on an option's value? Explain.
-
When you exhale, all of the air in your lungs must exit through the trachea. If you exhale through your nose, this air subsequently leaves through your nostrils. The area of your nostrils is less...
-
A balloon is launched at sea level, where the air pressure is \(100 \mathrm{kPa}\). The helium has a volume of \(1000 \mathrm{~m}^{3}\) at this altitude. What is the volume of the helium when the...
-
A balloon is launched at sea level, where the air pressure is \(100 \mathrm{kPa}\). The density in the hot-air chamber is \(1.0 \mathrm{~kg} / \mathrm{m}^{3}\). What is the density of the air when...

Study smarter with the SolutionInn App