

Question: Table 3 Etch Rate Data (in min) rom the Plasma Etching Experiment Observations Power (W) Totals 575 542 530 539 570 2756 160 593 565
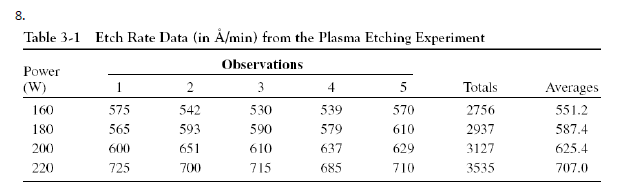
Table 3 Etch Rate Data (in min) rom the Plasma Etching Experiment Observations Power (W) Totals 575 542 530 539 570 2756 160 593 565 590 610 180 579 2937 651 610 637 200 600 629 3127 700 725 715 685 710 3535 220 Averages 551.2 587.4 625.4 707.0 Table 3 Etch Rate Data (in min) rom the Plasma Etching Experiment Observations Power (W) Totals 575 542 530 539 570 2756 160 593 565 590 610 180 579 2937 651 610 637 200 600 629 3127 700 725 715 685 710 3535 220 Averages 551.2 587.4 625.4 707.0
Step by Step Solution
There are 3 Steps involved in it
1 Expert Approved Answer
Step: 1 Unlock

Question Has Been Solved by an Expert!
Get step-by-step solutions from verified subject matter experts
Step: 2 Unlock
Step: 3 Unlock