

Question: Table 3 Histological analysis. Quantitative and morphometric analysis of lung tissue samples from LRR (low respiratory rate) and HRR (high respiratory rate) groups. Perivascular and

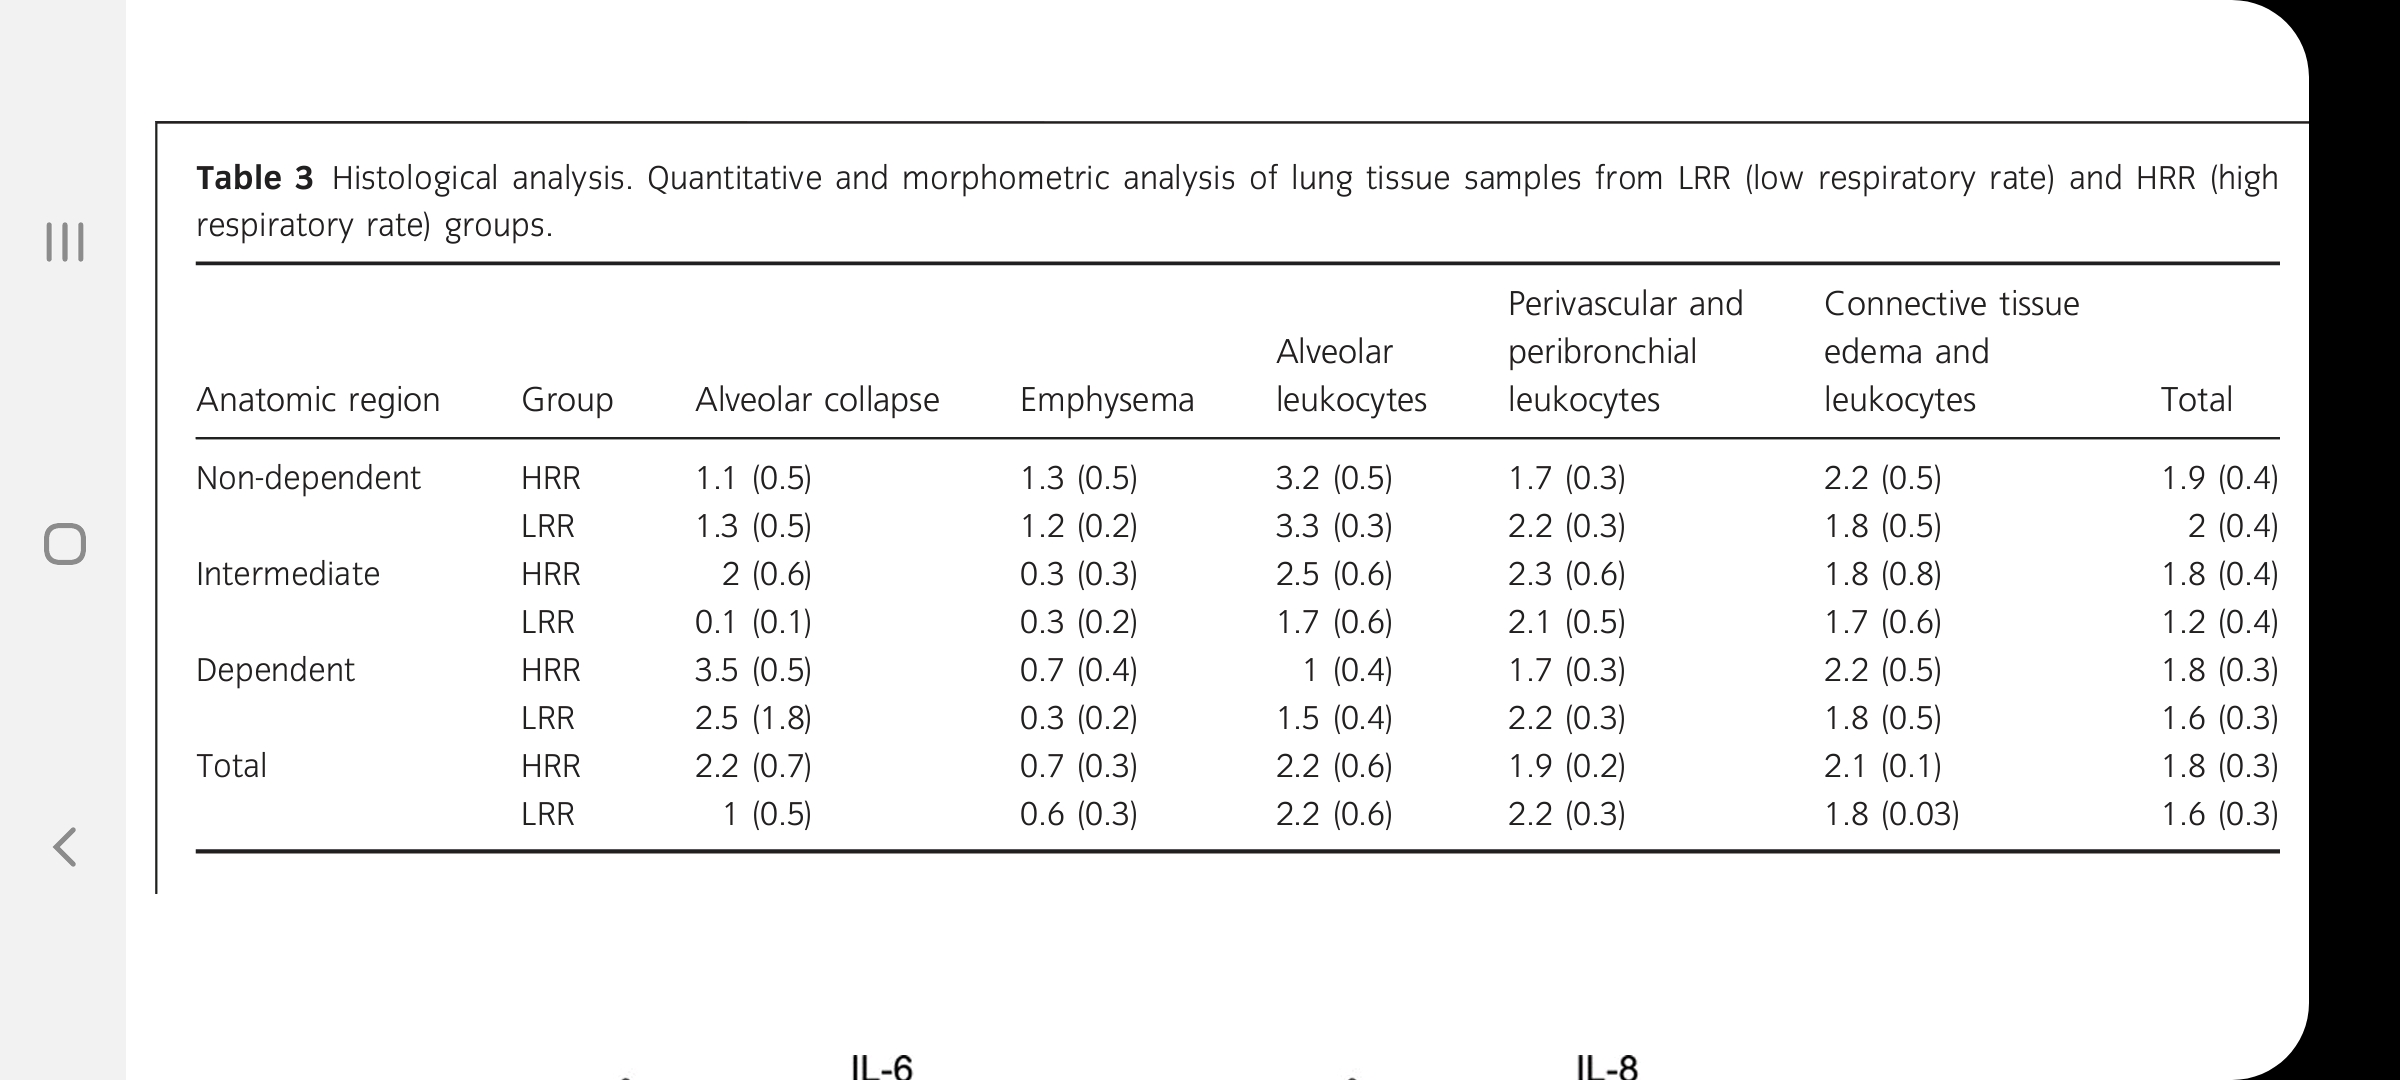
Table 3 Histological analysis. Quantitative and morphometric analysis of lung tissue samples from LRR (low respiratory rate) and HRR (high respiratory rate) groups. Perivascular and Connective tissue Alveolar peribronchial edema and Anatomic region Group Alveolar collapse Emphysema leukocytes leukocytes leukocytes Total Non-dependent HRR 1.1 (0.5) 1.3 (0.5) 3.2 (0.5) 1.7 (0.3) 2.2 (0.5) 1.9 (0.4) O LRR 1.3 (0.5) 1.2 (0.2) 3.3 (0.3) 2.2 (0.3) 1.8 (0.5) 2 (0.4) Intermediate HRR 2 (0.6) 0.3 (0.3) 2.5 (0.6) 2.3 (0.6) 1.8 (0.8) 1.8 (0.4) LRR 0.1 (0.1) 0.3 (0.2) 1.7 (0.6) 2.1 (0.5) 1.7 (0.6) 1.2 (0.4) Dependent HRR 3.5 (0.5) 0.7 (0.4) 1 (0.4) 1.7 (0.3) 2.2 (0.5) 1.8 (0.3) LRR 2.5 (1.8) 0.3 (0.2) 1.5 (0.4) 2.2 (0.3) 1.8 (0.5) 1.6 (0.3) Total HRR 2.2 (0.7) 0.7 (0.3) 2.2 (0.6) 1.9 (0.2) 2.1 (0.1) 1.8 (0.3) LRR 1 (0.5) 0.6 (0.3) 2.2 (0.6) 2.2 (0.3) 1.8 (0.03) 1.6 (0.3) 1 -6 11 -8
Step by Step Solution
There are 3 Steps involved in it

Get step-by-step solutions from verified subject matter experts