

Question: Table 3: Laser and Refraction Cell Data Incident Angle, 0; Refracted Angle, OT Degrees) Degrees) Sin0; (Degrees) Sin0 (Degrees) 0 0 0 0 5 5
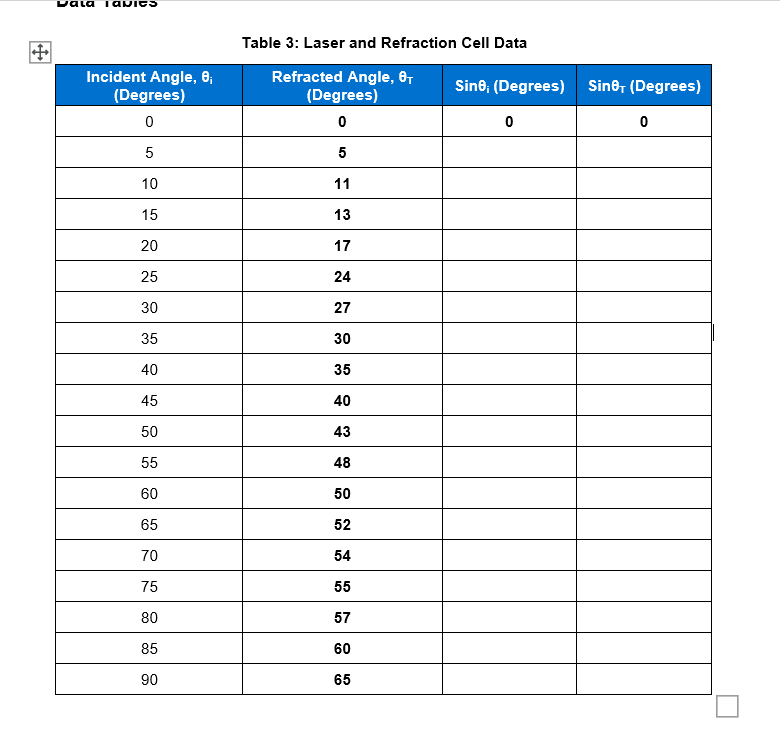
Table 3: Laser and Refraction Cell Data Incident Angle, 0; Refracted Angle, OT Degrees) Degrees) Sin0; (Degrees) Sin0 (Degrees) 0 0 0 0 5 5 10 11 15 13 20 17 25 24 30 27 35 30 40 35 45 40 50 43 55 48 60 50 65 52 70 54 75 55 80 57 85 60 90 655. Complete Table 3 by computing the sine of the incident and refracted angle. 6. Plot a graph of sin(0i) versus sin(Or). Construct your graph on a computer program such as Microsoft Excel@. If you do not have a graphing program installed on your computer, you can access one on the internet via the NCES website or the Online Chart Tool. 7. Add a linear trendline and display the equation on the graph. In the Error Analysis section of your report, combine the measured index of refractions from the slope and question 1 as an uncertainty range by averaging the two values and taking two-thirds the difference between them as uncertainty (e.g., 1.28 +/-0.03). Estimate the precision level from the uncertainty range, the accuracy level from the accepted value for the water's index, and discuss whether any systematic errors seem present from this comparison
Step by Step Solution
There are 3 Steps involved in it

Get step-by-step solutions from verified subject matter experts