

Question: Table 3: Scale variables and descriptive statistics Variables Std Mean deviation Age (N=113) 21,98 1.685 Grade point average (GPA) (N=109) 8.524 O 806 Entrepreneurial readiness:
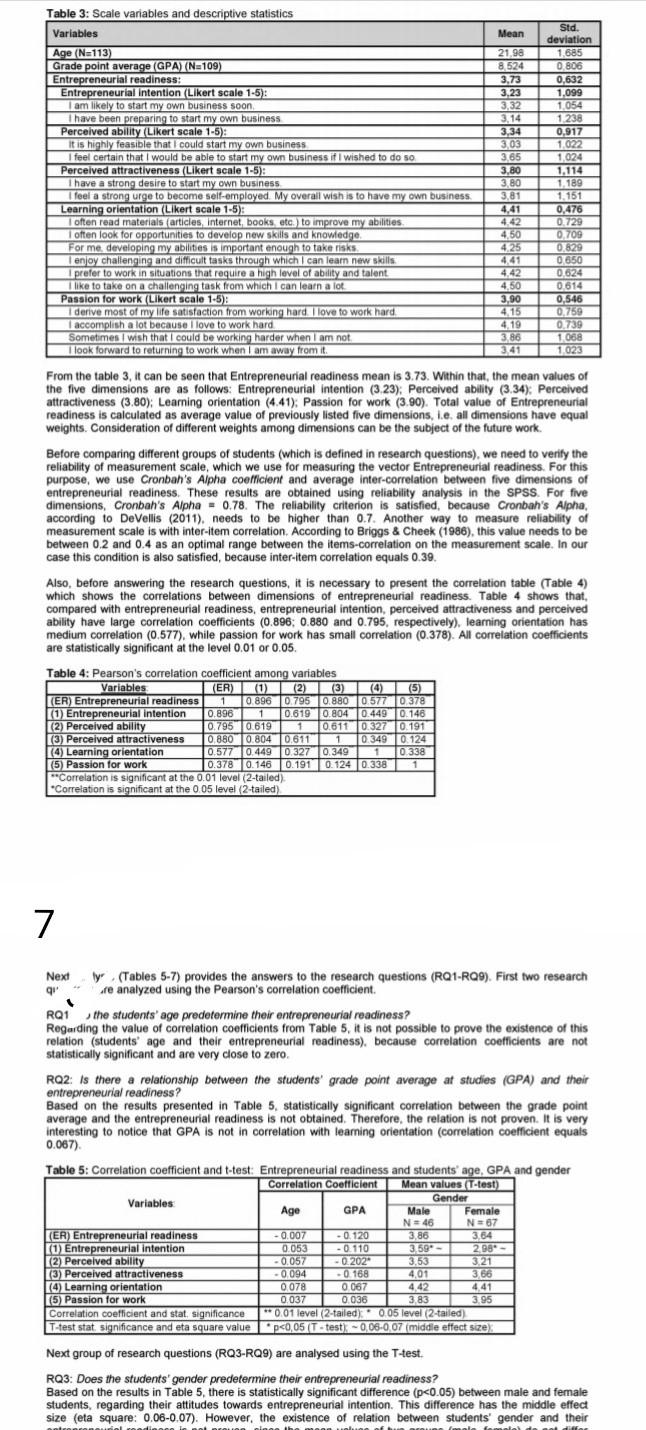
Table 3: Scale variables and descriptive statistics Variables Std Mean deviation Age (N=113) 21,98 1.685 Grade point average (GPA) (N=109) 8.524 O 806 Entrepreneurial readiness: 3,73 0,632 Entrepreneurial Intention (Likert scale 1-5): 3,23 1.099 I am likely to start my own business soon 3,32 1054 I have been preparing to start my own business 3.14 1.238 Perceived ability (Likert scale 1-5): 3,34 0.917 It is highly feasible that I could start my own business 303 1.022 I feel certain that I would be able to start my own business it I wished to do so 3.65 1,024 Perceived attractiveness (Likert scale 1-5): 3.80 1,114 I have a strong desire to start my own business 3.80 1.189 I feel a strong urge to become self-employed. My overall wish is to have my own business 3,81 1.151 Learning orientation (Likert scale 1-5): 4,41 0,476 often read materials articles, internet, books, etc. to improve my abilities 4.42 0.729 often look for opportunities to develop new skills and knowledge 4,50 0.709 For me developing my abilities is important enough to take risks 4.25 0.829 I enjoy challenging and difficult tasks through which can learn new skills 4.41 0650 I prefer to work in situations that require a high level of ability and talent 4,42 0.624 I like to take on a challenging task from which I can learn a lot 4,50 0.614 Passion for work (Likert scale 1-5): 3,90 0,546 I derive most of my life satisfaction from working hard. I love to work hard 4,15 0.769 I accomplish a lot because I love to work hard 4.19 0.739 Sometimes I wish that I could be working harder when I am not 3,86 1 068 I look forward to returning to work when I am away from it. 3:41 1023 From the table 3. It can be seen that Entrepreneurial readiness mean is 3.73. Within that, the mean values of the five dimensions are as follows: Entrepreneurial intention (3.23); Perceived ability (3.34): Perceived attractiveness (3.80): Learning orientation (4.41), Passion for work (3.90). Total value of Entrepreneurial readiness is calculated as average value of previously listed five dimensions, i.e. all dimensions have equal weights. Consideration of different weights among dimensions can be the subject of the future work. Before comparing different groups of students (which is defined in research questions), we need to verify the reliability of measurement scale, which we use for measuring the vector Entrepreneurial readiness. For this purpose, we use Cronbah's Alpha coefficient and average inter-correlation between five dimensions of entrepreneurial readiness. These results are obtained using reliability analysis in the SPSS. For five dimensions, Cronbah's Alpha = 0.78. The reliability criterion is satisfied, because Cronbah's Alpha, according to DeVellis (2011). needs to be higher than 0.7. Another way to measure reliability of measurement scale is with inter-item correlation. According to Briggs & Cheek (1986), this value needs to be between 0.2 and 0.4 as an optimal range between the items-correlation on the measurement scale. In our case this condition is also satisfied, because inter-item correlation equals 0.39. Also, before answering the research questions, it is necessary to present the correlation table (Table 4) which shows the correlations between dimensions of entrepreneurial readiness. Table 4 shows that, compared with entrepreneurial readiness, entrepreneurial intention, perceived attractiveness and perceived ability have large correlation coefficients (0.896: 0.880 and 0.795, respectively), learning orientation has medium correlation (0.577), while passion for work has small correlation (0.378). All correlation coefficients are statistically significant at the level 0.01 or 0.05. Table 4: Pearson's correlation coefficient among variables Variables (ER) (1) (2) (3) (4) (4) (5) (ER) Entrepreneurial readiness 1 0.896 0.795 0.880 0.577 0.378 (1) Entrepreneurial intention 0.896 1 0.619 0.804 0.449 0.146 (2) Perceived ability 0.795 0.619 1 0.611 0.327 10 191 (3) Perceived attractiveness 0.860 0.804 0.611 1 0.349 0.124 (4) Learning orientation 0.577 0.449 0.327 0.349 1 0338 (5) Passion for work 0.378 10.146 0.191 0.124 0.338 1 **Correlation is significant at the 0.01 level 2-tailed) *Correlation is significant at the 0.05 level (2-tailed) 7 Next ly (Tables 5-7) provides the answers to the research questions (RQ1-R99). First two research qr re analyzed using the Pearson's correlation coefficient RQ1 the students' age predetermine their entrepreneurial readiness? Regarding the value of correlation coefficients from Table 5, it is not possible to prove the existence of this relation (students' age and their entrepreneurial readiness), because correlation coefficients are not statistically significant and are very close to zero. RQ2: Is there a relationship between the students' grade point average at studies (GPA) and their entrepreneurial readiness? Based on the results presented in Table 5. statistically significant correlation between the grade point average and the entrepreneurial readiness is not obtained. Therefore, the relation is not proven. It is very interesting to notice that GPA is not in correlation with learning orientation (correlation coefficient equals 0.067) Table 5: Correlation coefficient and t-test: Entrepreneurial readiness and students' age, GPA and gender Correlation coefficient Mean values (T-test) Variables Gender Age GPA Male Female N 46 N=67 (ER) Entrepreneurial readiness -0.007 -0.120 3,86 3,84 (1) Entrepreneurial intention 0.053 -0.110 3.59 - (2) Perceived ability -0.057 -0.202 353 3.21 (3) Perceived attractiveness -0.168 4,01 3.66 (4) Learning orientation 0.078 O 067 4.42 4.41 (5) Passion for work 0.037 0.036 3.83 3.95 Correlation coefficient and stat, significance ** 0.01 level (2-tailed) 0.05 level (2-tailed) T-test stat, significance and eta square value *p
Step by Step Solution
There are 3 Steps involved in it
1 Expert Approved Answer
Step: 1 Unlock

Question Has Been Solved by an Expert!
Get step-by-step solutions from verified subject matter experts
Step: 2 Unlock
Step: 3 Unlock