

Question: Table 3.13 Data for the Trout Experiment Code Hemoglobin (grams per 100 ml) AWN- 6.7 7.8 5.5 8.4 7.0 7.8 8.6 7.4 5.8 7.0 9.9
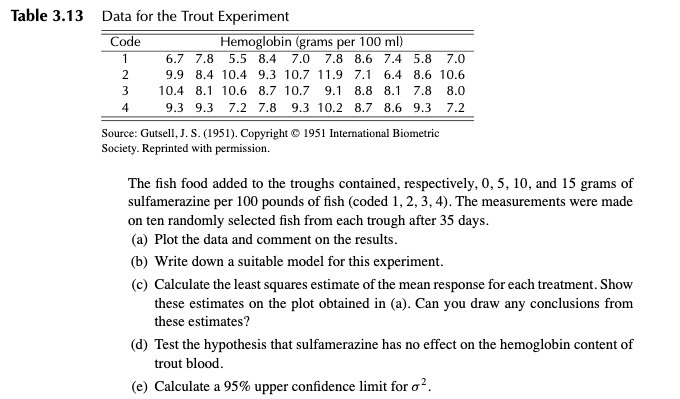
Table 3.13 Data for the Trout Experiment Code Hemoglobin (grams per 100 ml) AWN- 6.7 7.8 5.5 8.4 7.0 7.8 8.6 7.4 5.8 7.0 9.9 8.4 10.4 9.3 10.7 11.9 7.1 6.4 8.6 10.6 10.4 8.1 10.6 8.7 10.7 9.1 8.8 8.1 7.8 8.0 9.3 9.3 7.2 7.8 9.3 10.2 8.7 8.6 9.3 7.2 Source: Gutsell, J. S. (1951). Copyright @ 1951 International Biometric Society. Reprinted with permission. The fish food added to the troughs contained, respectively, 0, 5, 10, and 15 grams of sulfamerazine per 100 pounds of fish (coded 1, 2, 3, 4). The measurements were made on ten randomly selected fish from each trough after 35 days. (a) Plot the data and comment on the results. (b) Write down a suitable model for this experiment. (c) Calculate the least squares estimate of the mean response for each treatment. Show these estimates on the plot obtained in (a). Can you draw any conclusions from these estimates? (d) Test the hypothesis that sulfamerazine has no effect on the hemoglobin content of trout blood. (e) Calculate a 95% upper confidence limit for o
Step by Step Solution
There are 3 Steps involved in it

Get step-by-step solutions from verified subject matter experts