

Question: Table 3.15 ANOVA Table When the Beginning Salary is Regressed on Education ANOVA Table Source Sum of Squares df Mean Square F-Test Regression 7862535 7862535
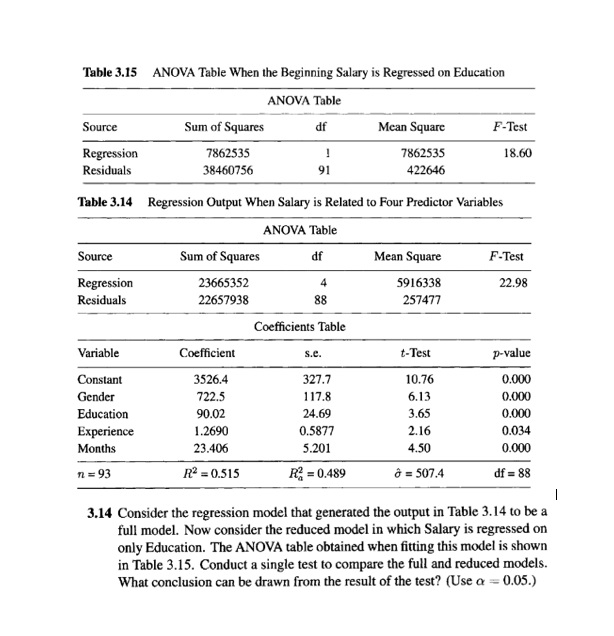
Table 3.15 ANOVA Table When the Beginning Salary is Regressed on Education ANOVA Table Source Sum of Squares df Mean Square F-Test Regression 7862535 7862535 18.60 Residuals 38460756 91 422646 Table 3.14 Regression Output When Salary is Related to Four Predictor Variables ANOVA Table Source Sum of Squares df Mean Square F-Test Regression 23665352 4 5916338 22.98 Residuals 22657938 88 257477 Coefficients Table Variable Coefficient S.C. t-Test p-value Constant 3526.4 327.7 10.76 0.000 Gender 722.5 1 17.8 5.13 0.000 Education 90.02 24.69 3.65 0.000 Experience 1.2690 0.5877 2.16 0.034 Months 23.406 5.201 4.50 0.000 1 = 93 R2 = 0.515 R2 = 0.489 a = 507.4 df = 88 3.14 Consider the regression model that generated the output in Table 3.14 to be a full model. Now consider the reduced model in which Salary is regressed on only Education. The ANOVA table obtained when fitting this model is shown in Table 3.15. Conduct a single test to compare the full and reduced models. What conclusion can be drawn from the result of the test? (Use a = 0.05.)
Step by Step Solution
There are 3 Steps involved in it

Get step-by-step solutions from verified subject matter experts