

Question: TABLE 3.5 Forecasting with a Spreadsheet: Pro Forma Financial Forecast for R&E Supplies, Incorporated, December 31, 2022 ($ thousands) A B C D Year 2021
| TABLE 3.5 Forecasting with a Spreadsheet: Pro Forma Financial Forecast for R&E Supplies, Incorporated, December 31, 2022 ($ thousands) | |||
| A | B | C | D |
|---|---|---|---|
| Year | 2021 Actual | 2022 | 2023 |
| Net sales | $ 20,613 | ||
| Growth rate in net sales | 25.00% | ||
| Cost of goods soldet sales | 86.0% | ||
| General, selling, and administrative expenseset sales | 12.00% | ||
| Long-term debt | $ 760 | $ 660 | |
| Current portion long-term debt | $ 100 | $ 100 | |
| Interest rate | 10.00% | ||
| Tax rate | 25.00% | ||
| Dividend/earnings after tax | 50.00% | ||
| Current assetset sales | 29.00% | ||
| Net fixed assets | $ 280 | ||
| Current liabilitieset sales | 14.50% | ||
| Owners equity | $ 1,730 | ||
| INCOME STATEMENT | |||
| Year | Equations | Forecast | Forecast |
| 2022 | 2022 | 2023 | |
| Net sales | = B3 + B3 * C4 | $ 25,766 | |
| Cost of goods sold | = C5 * C19 | 22,159 | |
| Gross profit | = C19 C20 | 3,607 | |
| General, selling, and administrative expenses | = C6 * C19 | 3,092 | |
| Interest expense | = C9 * (C7 + C8 + C40) | 228 | |
| Earnings before tax | = C21 C22 C23 | 287 | |
| Tax | = C10 * C24 | 72 | |
| Earnings after tax | = C24 C25 | 216 | |
| Dividends paid | = C11 * C26 | 108 | |
| Additions to retained earnings | = C26 C27 | 108 | |
| BALANCE SHEET | |||
| Current assets | = C12 * C19 | 7,472 | |
| Net fixed assets | = C13 | 280 | |
| Total assets | = C31 + C32 | 7,752 | |
| Current liabilities | = C14 * C19 | 3,736 | |
| Long-term debt | = C7 | 660 | |
| Owners equity | = B15 + C28 | 1,838 | |
| Total liabilities and owners equity | = C35 + C36 + C37 | 6,234 | |
| EXTERNAL FUNDING REQUIRED | = C33 C38 | $ 1,518 | |
| TABLE 3.1 Financial Statements for R&E Supplies, Incorporated, December 31, 20182021 ($ thousands) | ||||
| Income Statements | ||||
| 2018 | 2019 | 2020 | 2021* | |
|---|---|---|---|---|
| Net sales | $ 11,190 | $ 13,764 | $ 16,104 | $ 20,613 |
| Cost of goods sold | "9,400 | "11,699 | "13,688 | "17,727 |
| Gross profit | 1,790 | 2,065 | 2,416 | 2,886 |
| Expenses: | ||||
| General, selling, and administrative expenses | 1,198 | 1,431 | 1,795 | 2,408 |
| Net interest expense | 100 | 103 | 110 | 90 |
| Earnings before tax | 492 | 531 | 511 | 388 |
| Tax | 123 | 133 | 128 | 97 |
| Earnings after tax | $ 369 | $ 398 | $ 383 | $ 291 |
| Balance Sheets | ||||
| Assets | ||||
| Current assets: | ||||
| Cash and securities | $ 671 | $ 551 | $ 644 | $ 412 |
| Accounts receivable | 1,343 | 1,789 | 2,094 | 2,886 |
| Inventories | 1,119 | 1,376 | 1,932 | 2,267 |
| Prepaid expenses | 14 | 12 | 15 | 18 |
| Total current assets | 3,147 | 3,728 | 4,685 | 5,583 |
| Net fixed assets | "128 | "124 | "295 | "287 |
| Total assets | $ 3,275 | $ 3,852 | $ 4,980 | $ 5,870 |
| Liabilities and Owners Equity | ||||
| Current liabilities: | ||||
| Bank loan | $ 50 | $ 50 | $ 50 | $ 50 |
| Accounts payable | 1,007 | 1,443 | 2,426 | 3,212 |
| Current portion long-term debt | 60 | 50 | 50 | 100 |
| Accrued wages | 5 | 7 | 10 | 18 |
| Total current liabilities | 1,122 | 1,550 | 2,536 | 3,380 |
| Long-term debt | 960 | 910 | 860 | 760 |
| Common stock | 150 | 150 | 150 | 150 |
| Retained earnings | "1,043 | "1,242 | "1,434 | "1,580 |
| Total liabilities and owners equity | $ 3,275 | $ 3,852 | $ 4,980 | $ 5,870 |
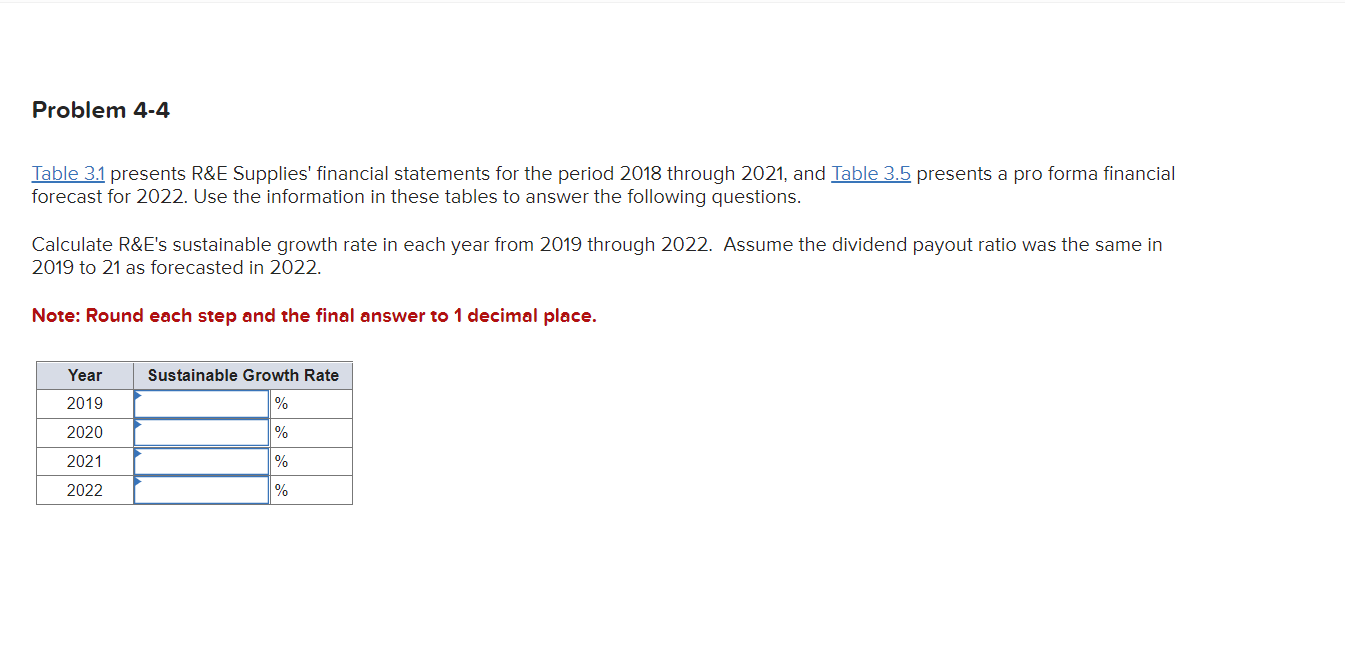
Table 3.1 presents R\&E Supplies' financial statements for the period 2018 through 2021 , and presents a pro forma financial forecast for 2022 . Use the information in these tables to answer the following questions. Calculate R\&E's sustainable growth rate in each year from 2019 through 2022. Assume the dividend payout ratio was the same in 2019 to 21 as forecasted in 2022. Note: Round each step and the final answer to 1 decimal place
Step by Step Solution
There are 3 Steps involved in it
1 Expert Approved Answer
Step: 1 Unlock

Question Has Been Solved by an Expert!
Get step-by-step solutions from verified subject matter experts
Step: 2 Unlock
Step: 3 Unlock