

Question: table [ [ 4 . 5 , Analyse fatigue in engineering structures ] , [ , i ) ] , [ , table
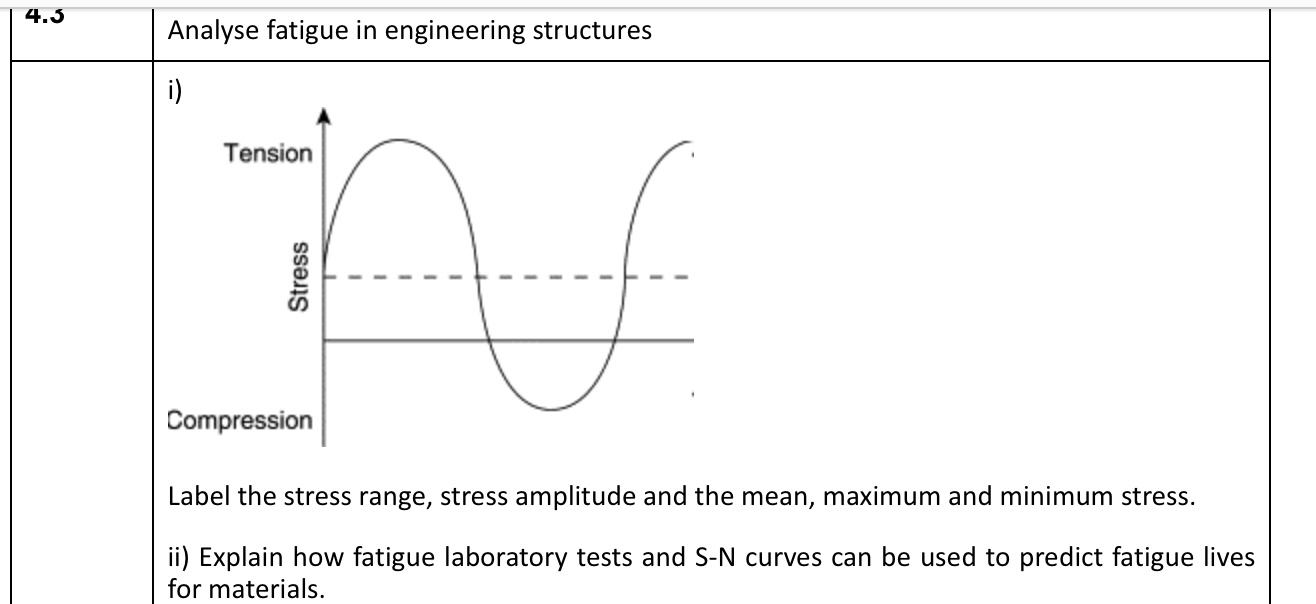
tableAnalyse fatigue in engineering structuresitableLabel the stress range, stress amplitude and the mean, maximum and minimum stress.ii Explain how fatigue laboratory tests and SN curves can be used to predict fatigue livesfor materials.
Step by Step Solution
There are 3 Steps involved in it
1 Expert Approved Answer
Step: 1 Unlock

Question Has Been Solved by an Expert!
Get step-by-step solutions from verified subject matter experts
Step: 2 Unlock
Step: 3 Unlock