

Question: Table 4: Probability (propensity) predicted by a classifier on 20 records, each of which is either positive or negative. There are 10 positive and 10
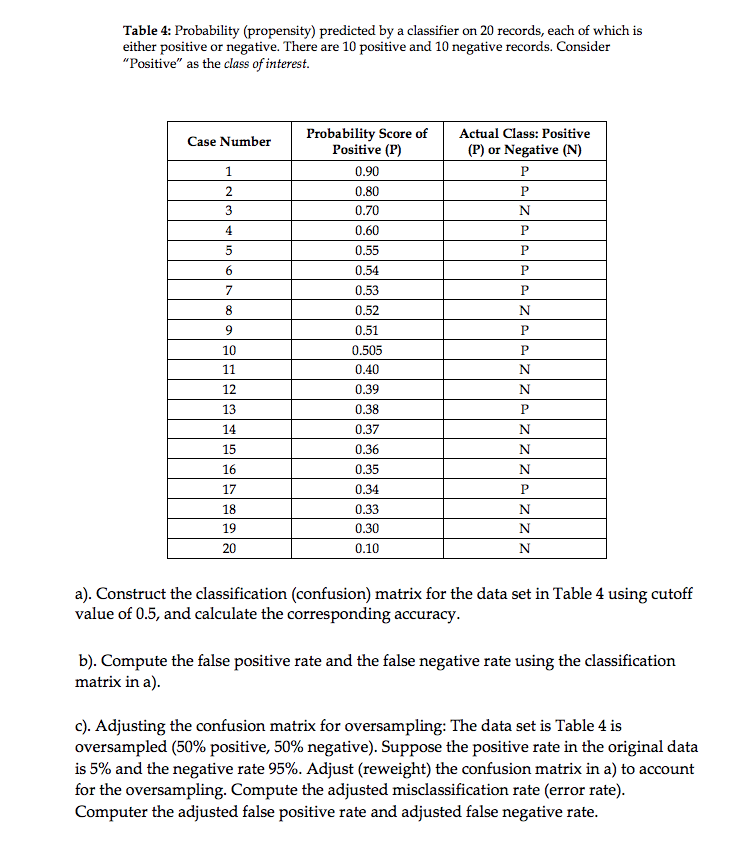
Table 4: Probability (propensity) predicted by a classifier on 20 records, each of which is either positive or negative. There are 10 positive and 10 negative records. Consider "Positive" as the class of interest Probability Score ofActual Class: Positive Case Number Positive (P) 0.90 0.80 0.70 0.60 0.55 0.54 0.53 0.52 0.51 0.505 0.40 0.39 0.38 0.37 0.36 0.35 0.34 0.33 0.30 0.10 (P) or Negative (N) 10 12 13 14 15 16 17 18 19 20 a). Construct the classification (confusion) matrix for the data set in Table 4 using cutoff value of 0.5, and calculate the corresponding accuracy b). Compute the false positive rate and the false negative rate using the classification matrix in a) c). Adjusting the confusion matrix for oversampling: The data set is Table 4 is oversampled (50% positive, 50% negative). Suppose the positive rate in the original data is 5% and the negative rate 95%. Adjust (reweight) the confusion matrix in a) to account for the oversampling. Compute the adjusted misclassification rate (error rate) Computer the adjusted false positive rate and adjusted false negative rate
Step by Step Solution
There are 3 Steps involved in it

Get step-by-step solutions from verified subject matter experts