

Question: Table 4.1 Ruff Sandpaper Co. Balance Sheets For the Years Ended 2009 and 2010 2010 2009 800 200 1,200 2,000 600 200 1,000 1.800 2,800
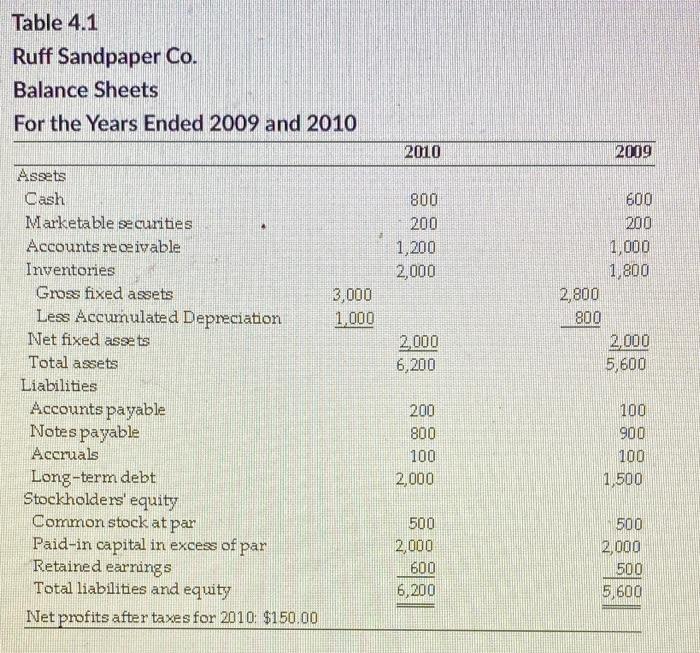
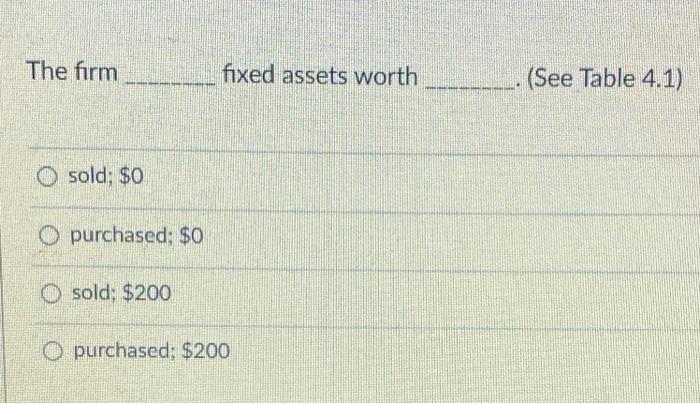
Table 4.1 Ruff Sandpaper Co. Balance Sheets For the Years Ended 2009 and 2010 2010 2009 800 200 1,200 2,000 600 200 1,000 1.800 2,800 800 2,000 5,600 3,000 1,000 2,000 6,200 Assets Cash Marketable securities Accounts receivable Inventories Gross fixed assets Less Accumulated Depreciation Net fixed assets Total assets Liabilities Accounts payable Notes payable Accruals Long-term debt Stockholders' equity Common stock at par Paid-in capital in excess of par Retained earrings Total liabilities and equity Net profits after taxes for 2010 $150.00 200 800 100 2,000 100 900 100 1,500 500 2,000 600 6,200 500 2,000 500 5,600 The firm fixed assets worth (See Table 4.1) O sold; $0 o purchased; $0 O sold: $200 o purchased: $200
Step by Step Solution
There are 3 Steps involved in it

Get step-by-step solutions from verified subject matter experts