

Question: Table 4a Model Summary Adjusted R Std. Error of Model R R Square Square the Estimate .094 009 .003 1.03626 a. Predictors: (Constant), Age ,
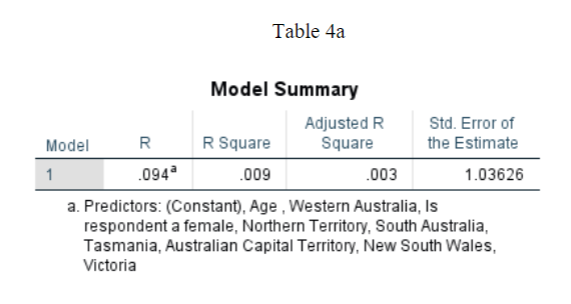
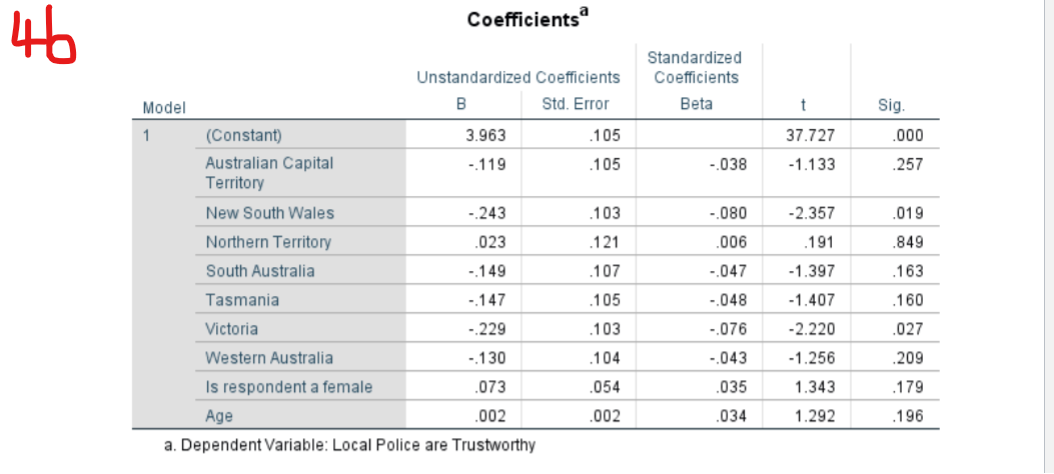
Table 4a Model Summary Adjusted R Std. Error of Model R R Square Square the Estimate .094 009 .003 1.03626 a. Predictors: (Constant), Age , Western Australia, Is respondent a female, Northern Territory, South Australia, Tasmania, Australian Capital Territory, New South Wales, Victoria46 Coefficients Standardized Unstandardized Coefficients Coefficients Model B Std. Error Beta Sig. 1 (Constant) 3.963 .105 37.727 .000 Australian Capital -.119 .105 -.038 -1.133 Territory 257 New South Wales -.243 103 -.080 -2.357 019 Northern Territory .023 .121 006 191 .849 South Australia -.149 107 -.047 -1.397 163 Tasmania -.147 105 -.048 -1.407 .160 Victoria -.229 .103 -.076 -2.220 .027 Western Australia -.130 .104 -.043 -1.256 209 Is respondent a female .073 .054 035 1.343 .179 Age 002 002 034 1.292 196 a. Dependent Variable: Local Police are Trustworthy
Step by Step Solution
There are 3 Steps involved in it

Get step-by-step solutions from verified subject matter experts