

Question: Table 5.11 Factors for Calculating Three-Sigma Limits for the Chart and R-Chart Size of Sample (n) Factor for UCL and LCL for c-bar- Charts A,
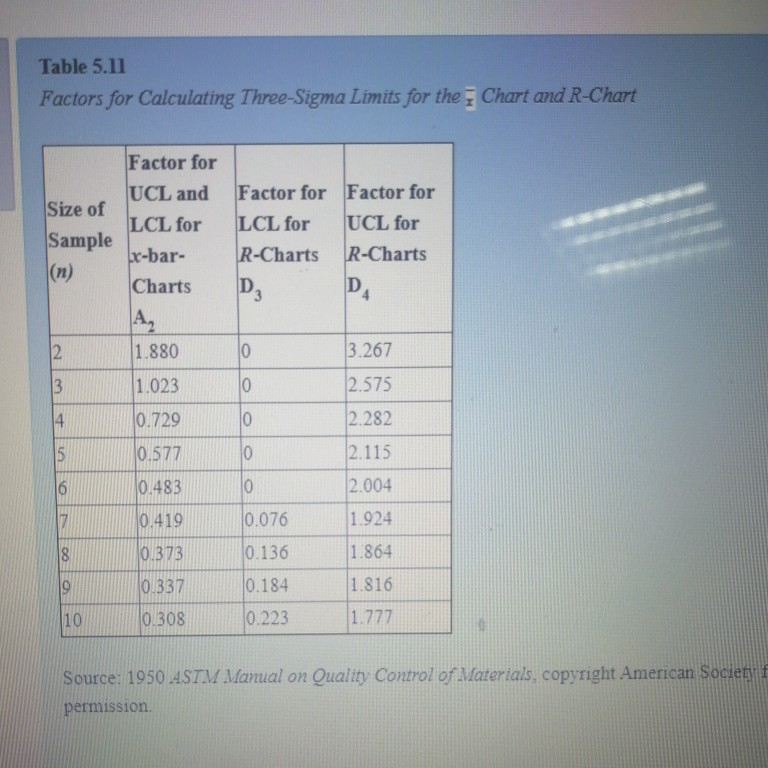
Table 5.11 Factors for Calculating Three-Sigma Limits for the Chart and R-Chart Size of Sample (n) Factor for UCL and LCL for c-bar- Charts A, 1.880 Factor for Factor for LCL for UCL for R-Charts R-Charts D DA 2 0 3.267 3 1.023 0 2.575 14 0.729 10 2.282 15 10.577 10 2.115 16 10.483 10 2.004 7 10.419 0.076 1.924 18 0.373 0.136 1.864 19 0.337 10.184 1.816 10 0.308 0.223 1.777 Source: 1950 ASTM Manual on Quality Control of Materials, copyright American Society f permission Table 5.11 Factors for Calculating Three-Sigma Limits for the Chart and R-Chart Size of Sample (n) Factor for UCL and LCL for c-bar- Charts A, 1.880 Factor for Factor for LCL for UCL for R-Charts R-Charts D DA 2 0 3.267 3 1.023 0 2.575 14 0.729 10 2.282 15 10.577 10 2.115 16 10.483 10 2.004 7 10.419 0.076 1.924 18 0.373 0.136 1.864 19 0.337 10.184 1.816 10 0.308 0.223 1.777 Source: 1950 ASTM Manual on Quality Control of Materials, copyright American Society f permission
Step by Step Solution
There are 3 Steps involved in it
1 Expert Approved Answer
Step: 1 Unlock

Question Has Been Solved by an Expert!
Get step-by-step solutions from verified subject matter experts
Step: 2 Unlock
Step: 3 Unlock