

Question: TABLE 5-RESPONSE AND DENIAL BY EXPERIMENTAL INTERVENTION Dependent variable: (LPM) Response (yes/no) Denial (yes/no) Full sample (1) Controls No dependents dependents p-value (3) with
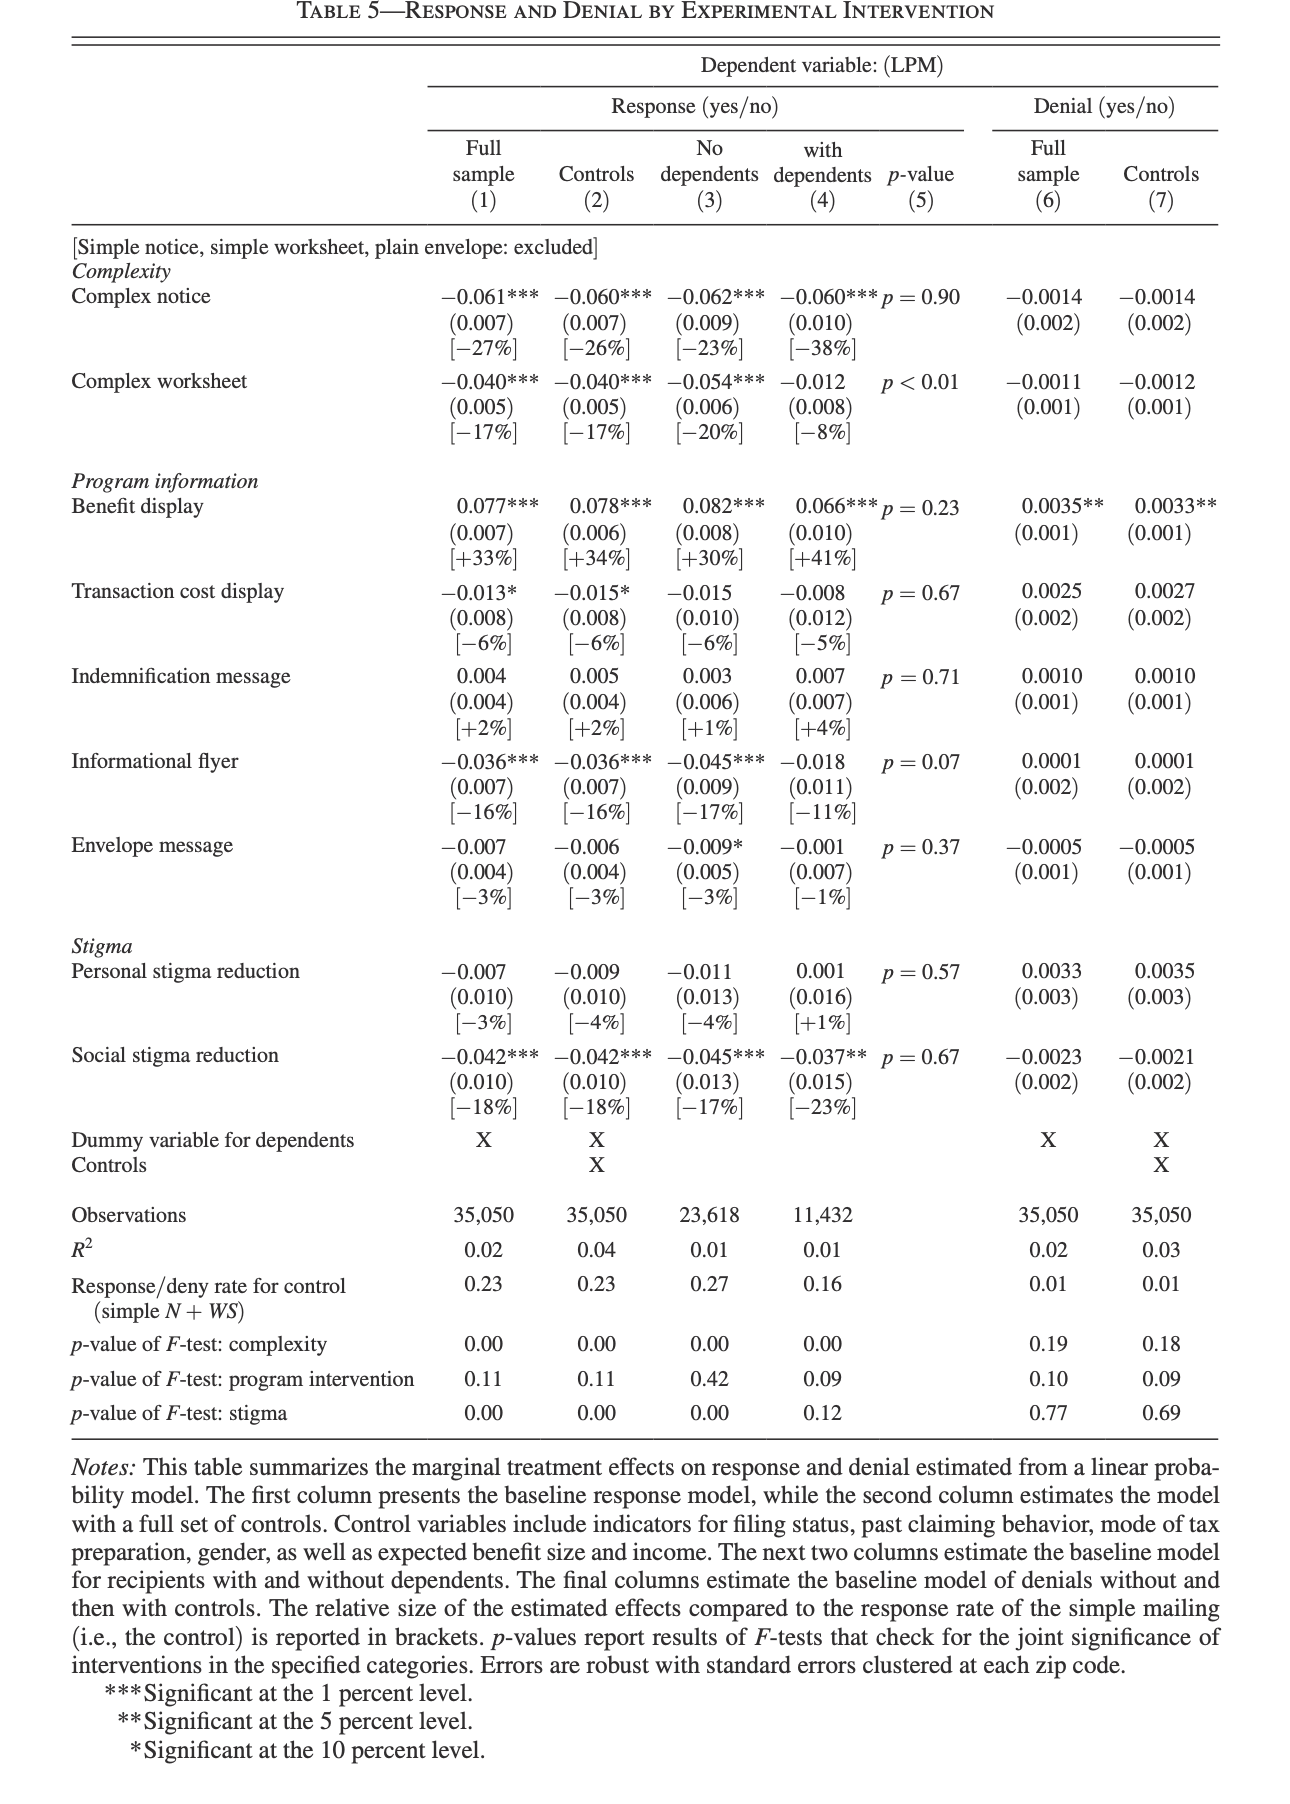
TABLE 5-RESPONSE AND DENIAL BY EXPERIMENTAL INTERVENTION Dependent variable: (LPM) Response (yes/no) Denial (yes/no) Full sample (1) Controls No dependents dependents p-value (3) with Full sample Controls (7) [Simple notice, simple worksheet, plain envelope: excluded] Complexity Complex notice -0.061*** 0.060*** 0.062*** -0.060*** (0.007) (0.007) (0.009) (0.010) [-27%] [-26%] [-23%] [-38%] *p = 0.90 -0.0014 -0.0014 (0.002) (0.002) Complex worksheet -0.040*** 0.040*** 0.054*** -0.012 P < 0.01 -0.0011 -0.0012 (0.005) [-17%] (0.005) (0.006) -17%] [-20%] (0.008) [-8%] (0.001) (0.001) Program information Benefit display 0.077*** 0.078*** 0.082*** 0.066*** P = 0.23 0.0035** 0.0033** (0.007) (0.006) (0.008) (0.010) (0.001) (0.001) [+33%] [+34%] [+30%] [+41%] Transaction cost display -0.013* -0.015* -0.015 -0.008 p = 0.67 0.0025 0.0027 (0.008) (0.008) (0.010) (0.012) (0.002) (0.002) [-6%] [-6%] [-6%] -5% Indemnification message 0.004 0.005 0.003 0.007 p = 0.71 0.0010 0.0010 (0.004) (0.004) (0.006) (0.007) (0.001) (0.001) [+2%] [+2%] [+1%] [+4%] Informational flyer -0.036*** 0.036*** -0.045*** -0.018 p = 0.07 0.0001 0.0001 (0.007) (0.007) (0.009) (0.011) (0.002) (0.002) [-16%] [-16%] [-17%] [-11%] Envelope message -0.007 -0.006 -0.009* -0.001 P = 0.37 -0.0005 -0.0005 (0.004) (0.004) (0.005) (0.007) (0.001) (0.001) [-3%] [-3%] [-3%] [1%] Stigma Personal stigma reduction -0.007 -0.009 -0.011 0.001 p = 0.57 0.0033 0.0035 (0.010) (0.010) (0.013) (0.016) (0.003) (0.003) Social stigma reduction [-3%] [-4%] [-4%] -0.042*** 0.042*** 0.045*** 0.037** p = 0.67 (0.010) (0.010) (0.013) (0.015) [+1%] -0.0023 -0.0021 (0.002) (0.002) [-18%] [18%] [-17%] [-23%] Dummy variable for dependents Controls X X X X X Observations 35,050 35,050 23,618 11,432 35,050 35,050 R 0.02 0.04 0.01 0.01 0.02 0.03 Response/deny rate for control 0.23 0.23 0.27 0.16 0.01 0.01 (simple N + WS) p-value of F-test: complexity 0.00 0.00 0.00 0.00 0.19 0.18 p-value of F-test: program intervention p-value of F-test: stigma 0.11 0.11 0.42 0.09 0.10 0.09 0.00 0.00 0.00 0.12 0.77 0.69 Notes: This table summarizes the marginal treatment effects on response and denial estimated from a linear proba- bility model. The first column presents the baseline response model, while the second column estimates the model with a full set of controls. Control variables include indicators for filing status, past claiming behavior, mode of tax preparation, gender, as well as expected benefit size and income. The next two columns estimate the baseline model for recipients with and without dependents. The final columns estimate the baseline model of denials without and then with controls. The relative size of the estimated effects compared to the response rate of the simple mailing (i.e., the control) is reported in brackets. p-values report results of F-tests that check for the joint significance of interventions in the specified categories. Errors are robust with standard errors clustered at each zip code. ***Significant at the 1 percent level. **Significant at the 5 percent level. *Significant at the 10 percent level.
Step by Step Solution
There are 3 Steps involved in it

Get step-by-step solutions from verified subject matter experts