

Question: Table 6 E.4 presents 20 subgroups of five measurements on the critical dimension of a part produced by a machining process. a. Set up xbar
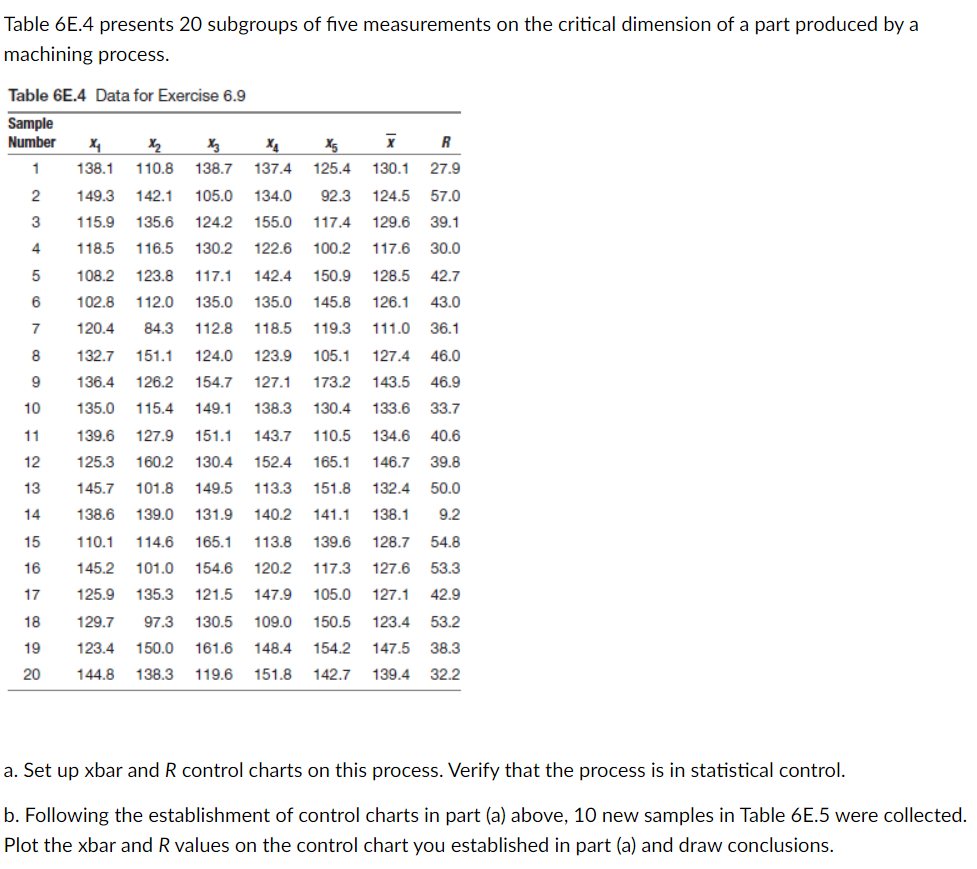
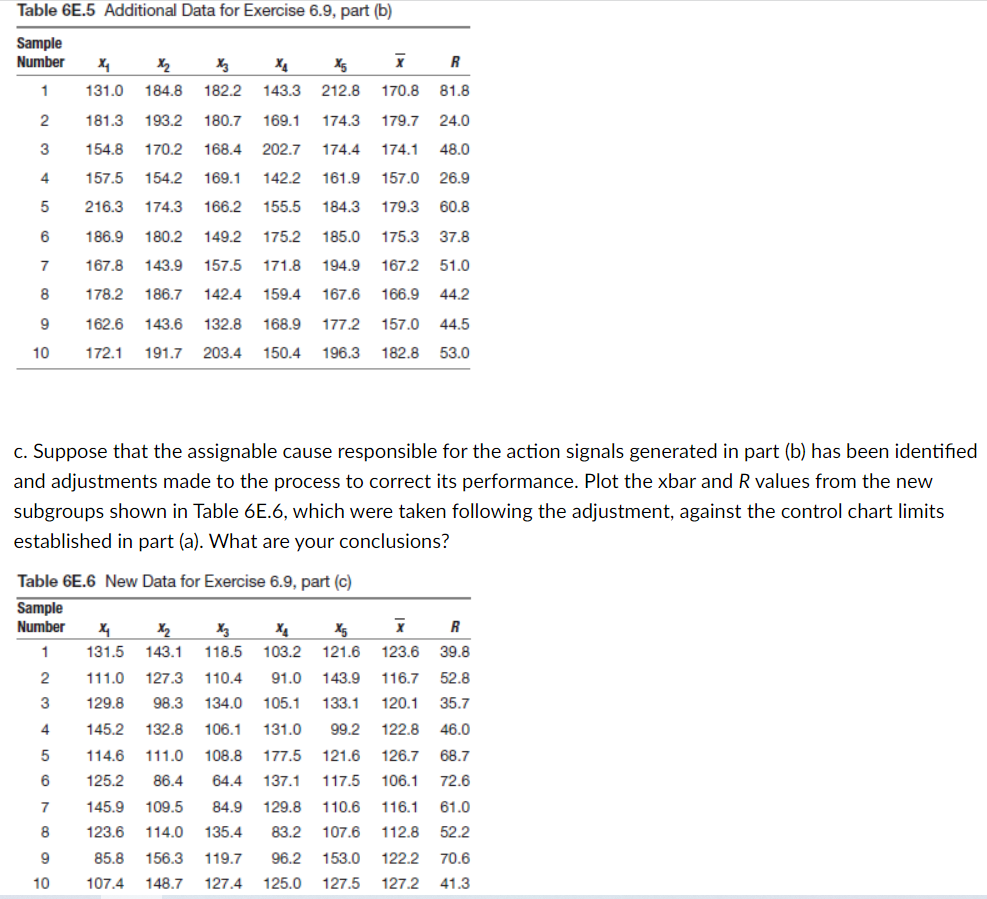
Table 6 E.4 presents 20 subgroups of five measurements on the critical dimension of a part produced by a machining process. a. Set up xbar and R control charts on this process. Verify that the process is in statistical control. b. Following the establishment of control charts in part (a) above, 10 new samples in Table 6E.5 were collected. Plot the xbar and R values on the control chart you established in part (a) and draw conclusions. c. Suppose that the assignable cause responsible for the action signals generated in part (b) has been identified and adjustments made to the process to correct its performance. Plot the xbar and R values from the new subgroups shown in Table 6E.6, which were taken following the adjustment, against the control chart limits established in part (a). What are your conclusions
Step by Step Solution
There are 3 Steps involved in it

Get step-by-step solutions from verified subject matter experts