

Question: TABLE 6.4 IM&C's guano project. Revised analysis with immediate expensing of investment expenditures. Panel A Capital Investment 1 Investment in Fixed Assets 2 Sale
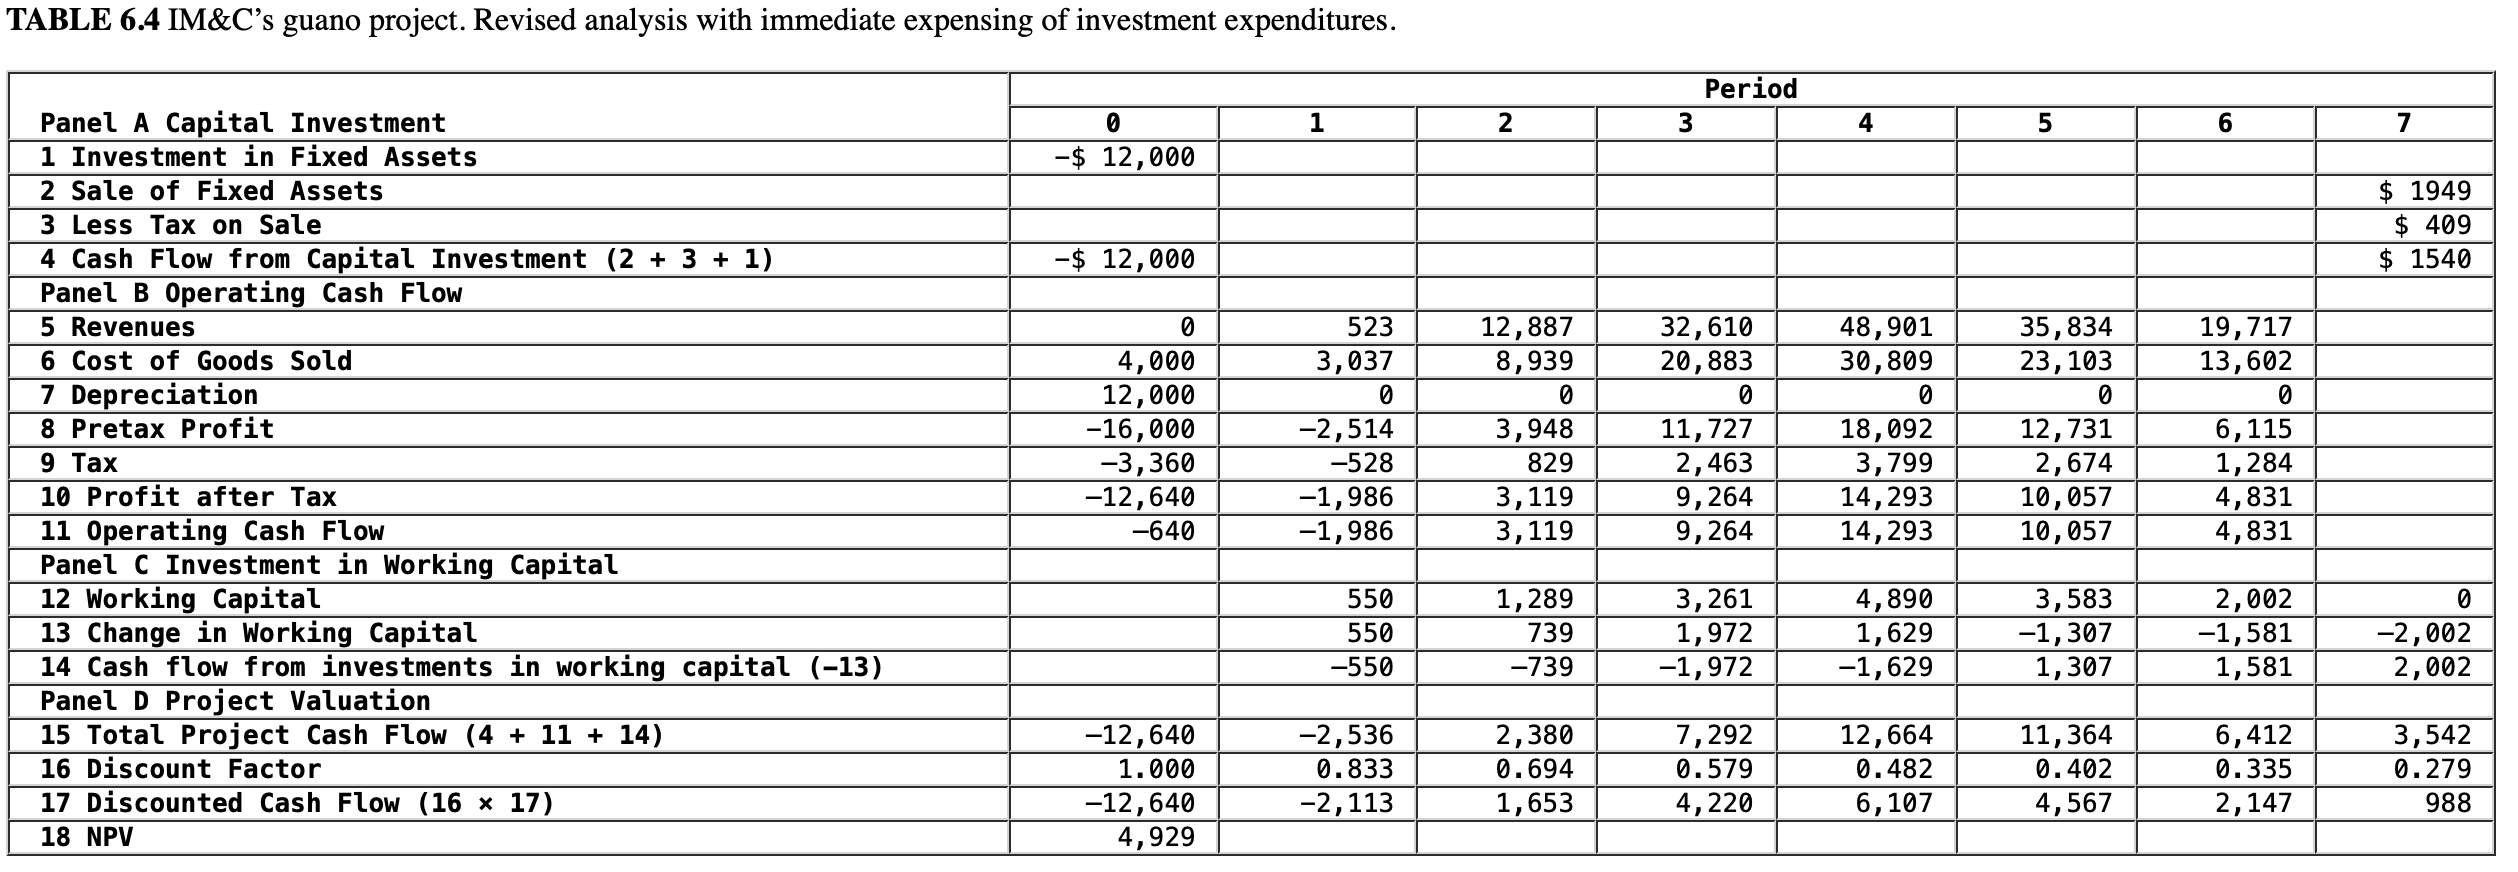
TABLE 6.4 IM&C's guano project. Revised analysis with immediate expensing of investment expenditures. Panel A Capital Investment 1 Investment in Fixed Assets 2 Sale of Fixed Assets 3 Less Tax on Sale Period 0 1 2 3 4 5 6 7 -$ 12,000 4 Cash Flow from Capital Investment (2 + 3 + 1) -$ 12,000 $ 1949 $ 409 $ 1540 Panel B Operating Cash Flow 5 Revenues 6 Cost of Goods Sold 7 Depreciation 8 Pretax Profit 9 Tax 10 Profit after Tax 11 Operating Cash Flow 0 4,000 523 3,037 12,887 8,939 32,610 20,883 48,901 30,809 35,834 23,103 19,717 13,602 12,000 0 0 0 0 0 0 -16,000 -2,514 3,948 11,727 18,092 12,731 6,115 -3,360 -528 829 2,463 3,799 2,674 1,284 -12,640 -1,986 3,119 9,264 14,293 10,057 4,831 -640 -1,986 3,119 9,264 14,293 10,057 4,831 Panel C Investment in Working Capital 12 Working Capital 550 1,289 3,261 4,890 3,583 2,002 0 13 Change in Working Capital 550 739 1,972 1,629 -1,307 -1,581 -2,002 14 Cash flow from investments in working capital (-13) -550 -739 -1,972 -1,629 1,307 1,581 2,002 Panel D Project Valuation 15 Total Project Cash Flow (4 + 11 + 14) 16 Discount Factor -12,640 1.000 -2,536 2,380 7,292 12,664 11,364 6,412 3,542 0.833 0.694 0.579 0.482 0.402 0.335 0.279 17 Discounted Cash Flow (16 17) -12,640 -2,113 1,653 4,220 6,107 4,567 2,147 988 18 NPV 4,929
Step by Step Solution
There are 3 Steps involved in it

Get step-by-step solutions from verified subject matter experts