

Question: Table 9 . 5 Expected Times and Variances for the Porta - Vac Project Activities A Expected Time ( weeks ) 6 2 3 5
Table
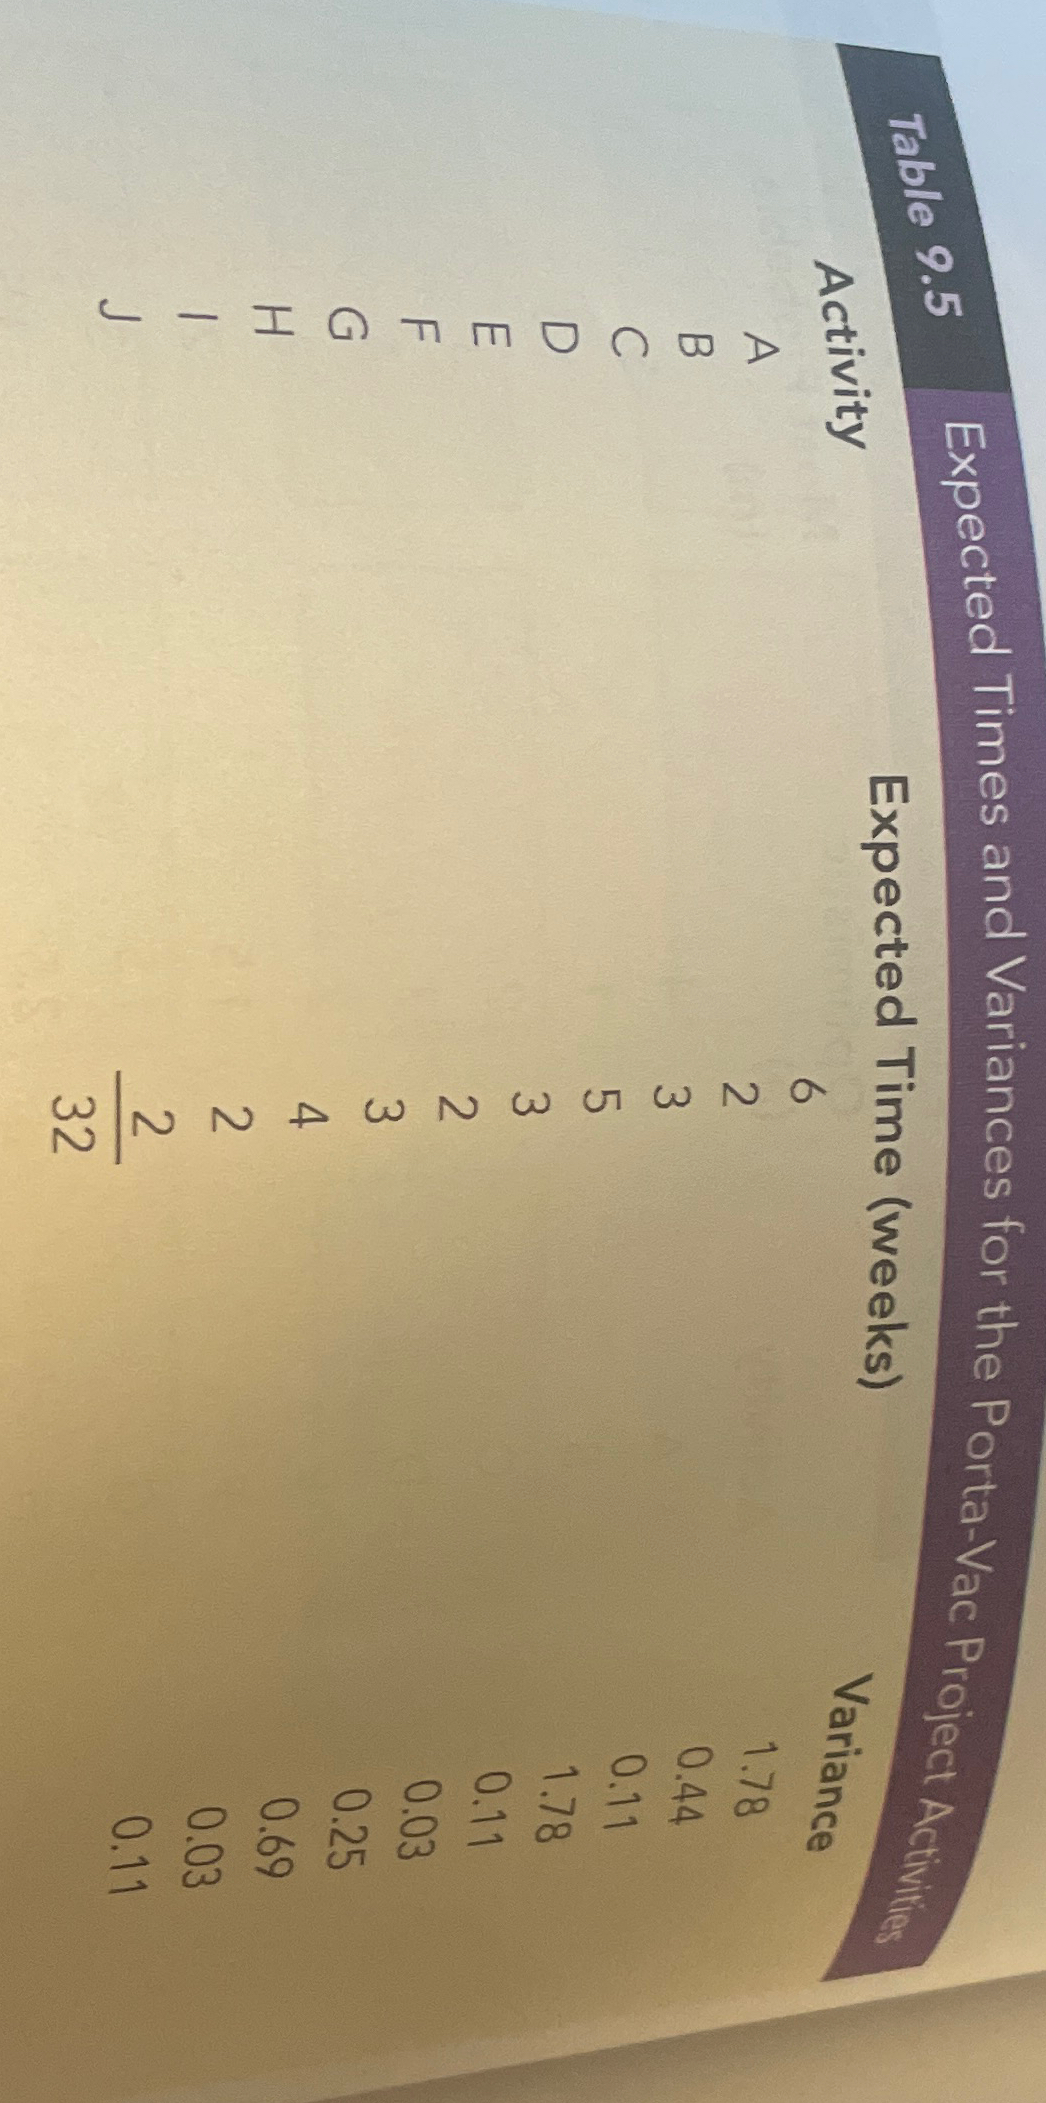
Expected Times and Variances for the PortaVac Project Activities
A
Expected
Time weeks
Variance
J
Step by Step Solution
There are 3 Steps involved in it
1 Expert Approved Answer
Step: 1 Unlock

Question Has Been Solved by an Expert!
Get step-by-step solutions from verified subject matter experts
Step: 2 Unlock
Step: 3 Unlock