

Question: Table 9.2 Average Returns for Bonds Long-Term Treasury Bonds 0.0% 1950 to 1959 1960 to 1969 1.6 1970 to 1979 5.7 Average Average Average Average
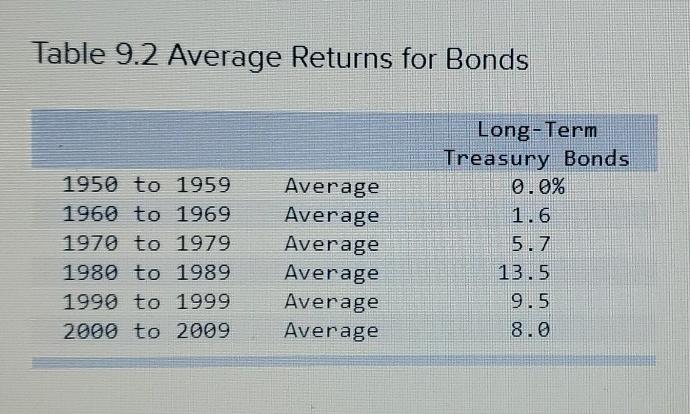
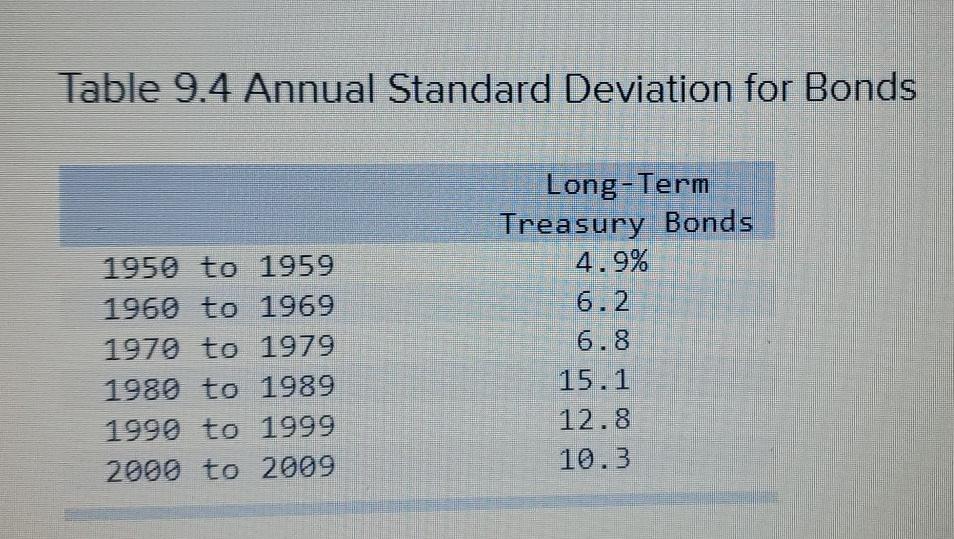
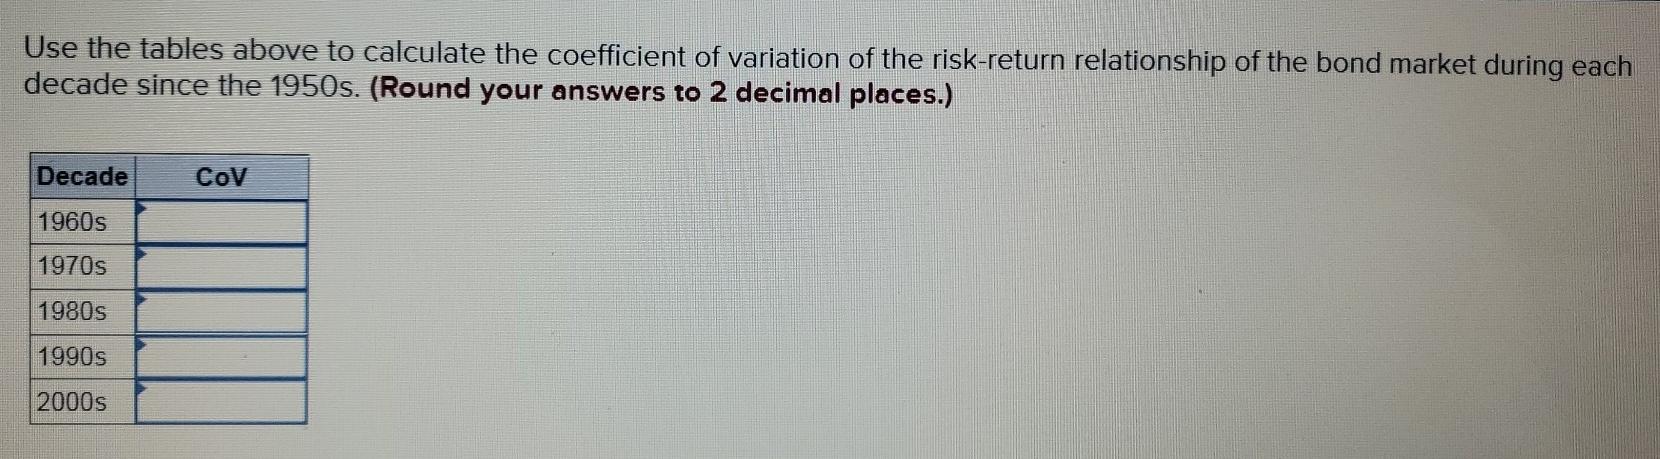
Table 9.2 Average Returns for Bonds Long-Term Treasury Bonds 0.0% 1950 to 1959 1960 to 1969 1.6 1970 to 1979 5.7 Average Average Average Average Average Average 1980 to 1989 13.5 1990 to 1999 9.5 2000 to 2009 8.0 Table 9.4 Annual Standard Deviation for Bonds 1950 to 1959 Long-Term Treasury Bonds 4.9% 6.2 6.8 15.1 1960 to 1969 1970 to 1979 1980 to 1989 12.8 1990 to 1999 10.3 2000 to 2009 Use the tables above to calculate the coefficient of variation of the risk-return relationship of the bond market during each decade since the 1950s. (Round your answers to 2 decimal places.) Decade Cov 1960s 1970s 1980s 1990s 2000s
Step by Step Solution
There are 3 Steps involved in it
1 Expert Approved Answer
Step: 1 Unlock

Question Has Been Solved by an Expert!
Get step-by-step solutions from verified subject matter experts
Step: 2 Unlock
Step: 3 Unlock