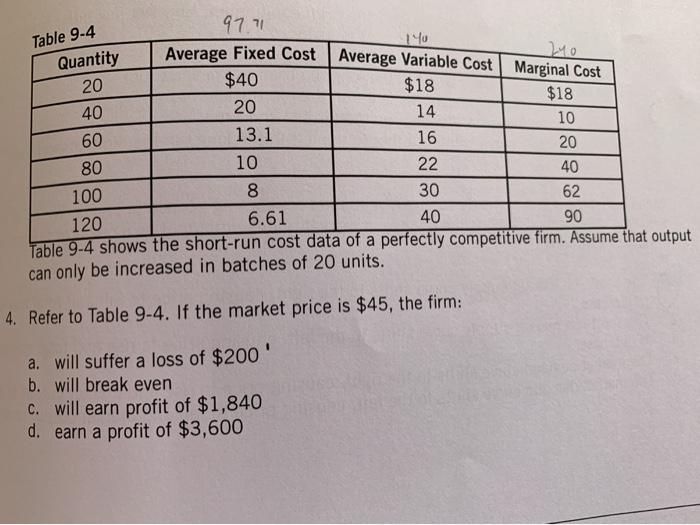
Question: Table 9-4 Average Fixe Quantity 20 97.71 140 Average Fixed Cost Average Variable Cost Marginal Cost $40 $18 $18 40 20 1 4 T 10

Table 9-4 Average Fixe Quantity 20 97.71 140
Table 9-4 Average Fixe Quantity 20 97.71 140 Average Fixed Cost Average Variable Cost Marginal Cost $40 $18 $18 40 20 1 4 T 10 60 13.1 1 16 120 80 10 22 40 100 8 30 62 6.61 40 Table 9-4 shows the short-run cost data of a perfectly competitive firm. Assume that output can only be increased in batches of 20 units. 90 120 4. Refer to Table 9-4. If the market price is $45, the firm: a. will suffer a loss of $200 b. will break even C. will earn profit of $1,840 d. earn a profit of $3,600

Step by Step Solution

There are 3 Steps involved in it

1 Expert Approved Answer
Step: 1 Unlock blur-text-image
Question Has Been Solved by an Expert!

Get step-by-step solutions from verified subject matter experts

Step: 2 Unlock
Step: 3 Unlock

Students Have Also Explored These Related General Management Questions!