

Question: TABLE A Cash Flow Projection Year: One Two Potential Gross Income Three Page 3 of 14 KPGI) Vacancy/Collect Losses (VCL) Effective Gross Income EGI) Operating
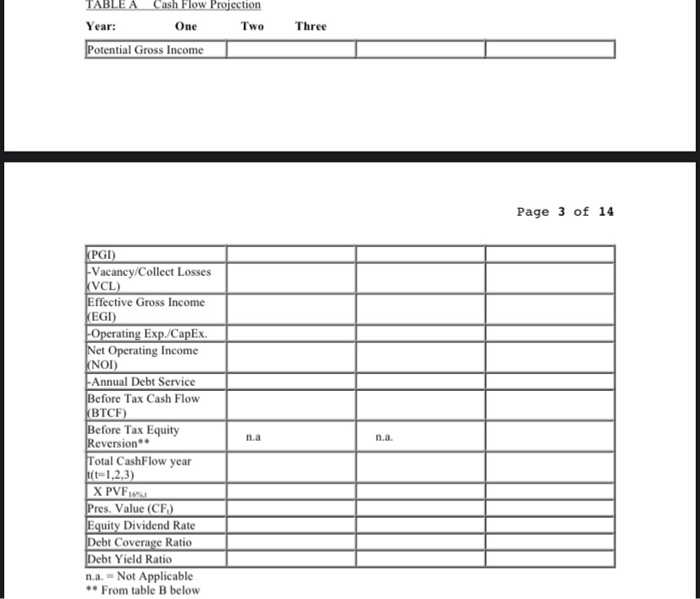
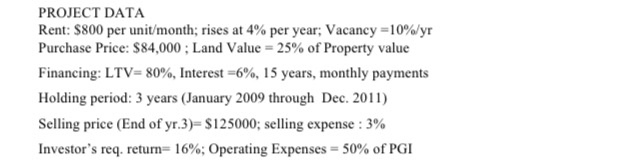
TABLE A Cash Flow Projection Year: One Two Potential Gross Income Three Page 3 of 14 KPGI) Vacancy/Collect Losses (VCL) Effective Gross Income EGI) Operating Exp./CapEx. Net Operating Income NOI) -Annual Debt Service Before Tax Cash Flow (BTCF) Before Tax Equity Reversion Total CashFlow year (t-1,2,3) X PVF Pres. Value (CF) Equity Dividend Rate Debt Coverage Ratio Debt Yield Ratio n.a. -Not Applicable ** From table B below na PROJECT DATA Rent: $800 per unit/month; rises at 4% per year; Vacancy=10%/yr Purchase Price: $84,000 : Land Value = 25% of Property value Financing: LTV=80%, Interest=6%, 15 years, monthly payments Holding period: 3 years (January 2009 through Dec. 2011) Selling price (End of yr.3)=$125000; selling expense : 3% Investor's req. retum- 16%; Operating Expenses -50% of PGI
Step by Step Solution
There are 3 Steps involved in it

Get step-by-step solutions from verified subject matter experts