

Question: Table A1 below * Use the scenario A for question 1-7. Scenario A. Dr. Abbas, a professor at a large community college, wanted to determine
Table A1 below
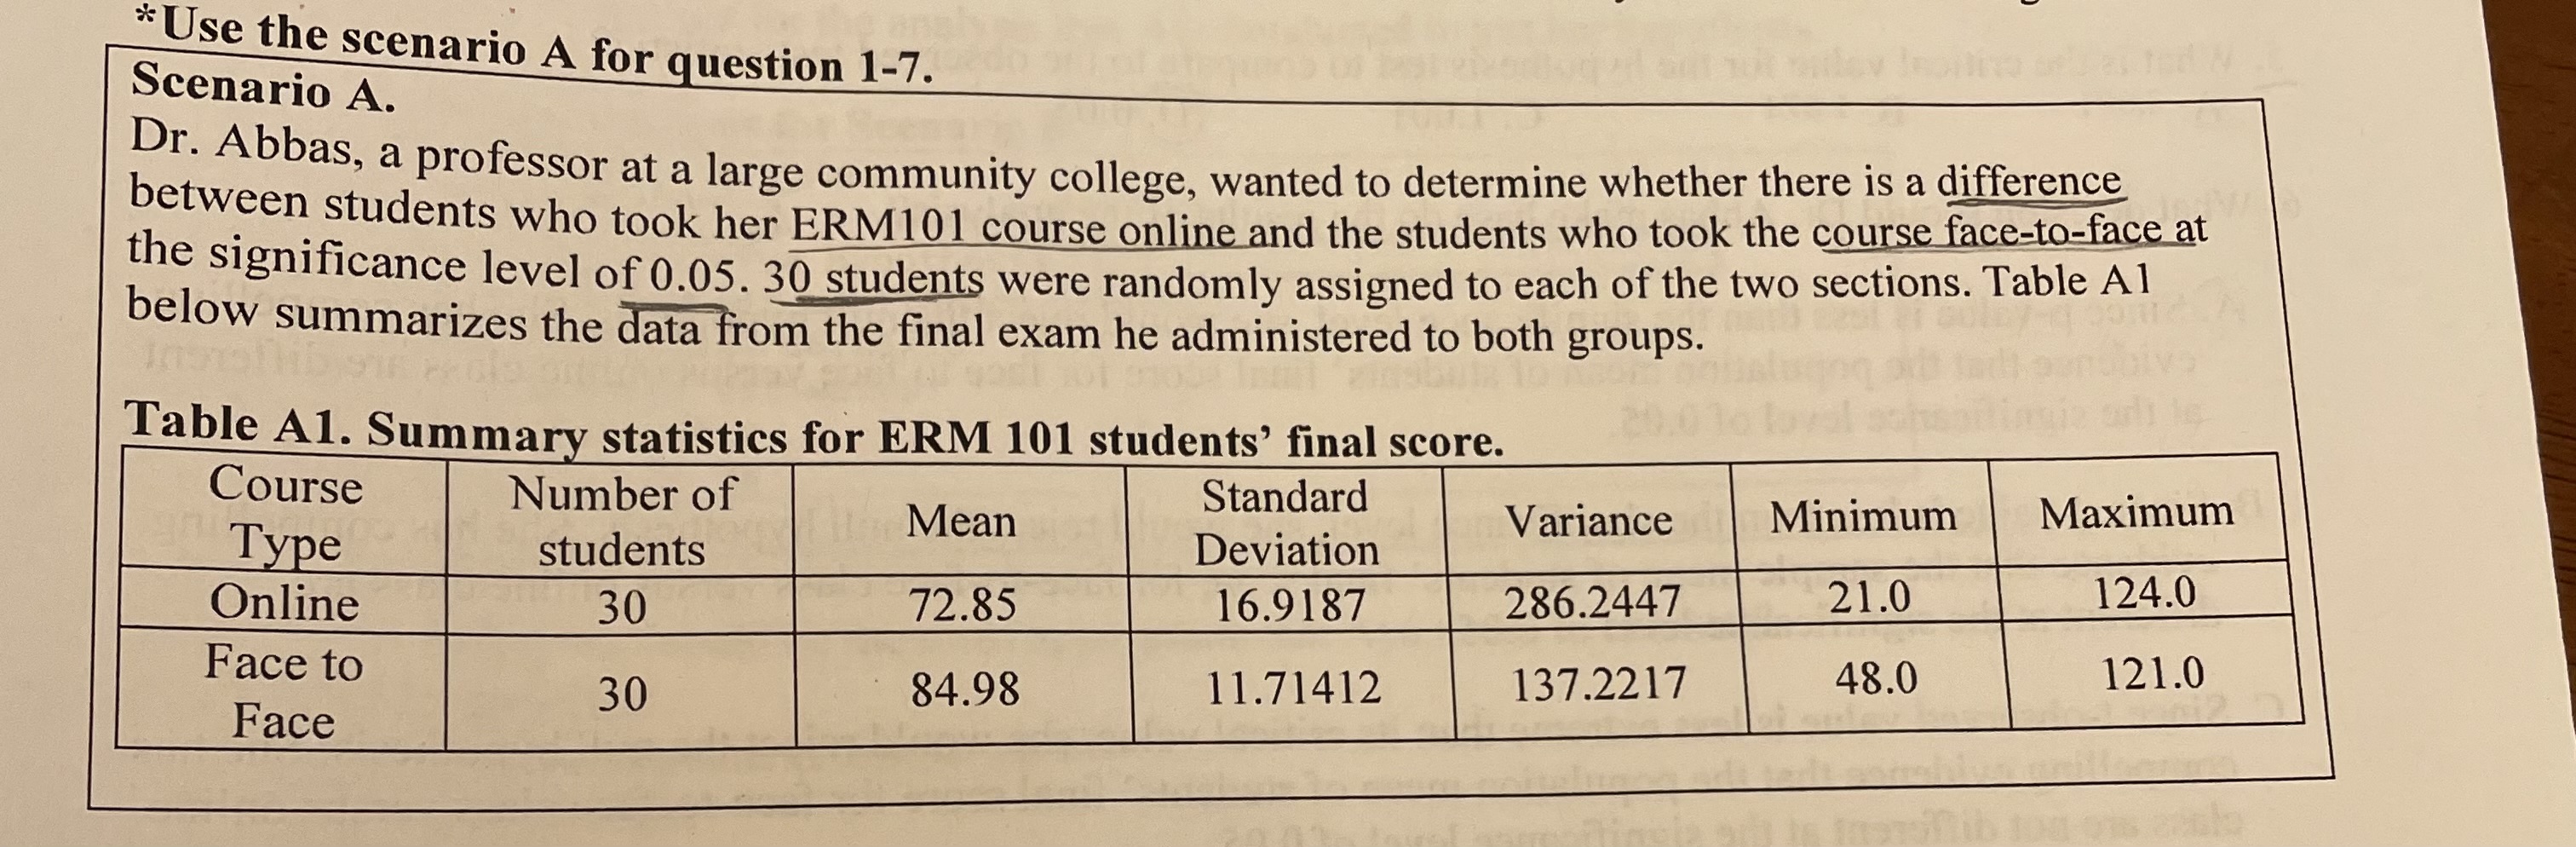
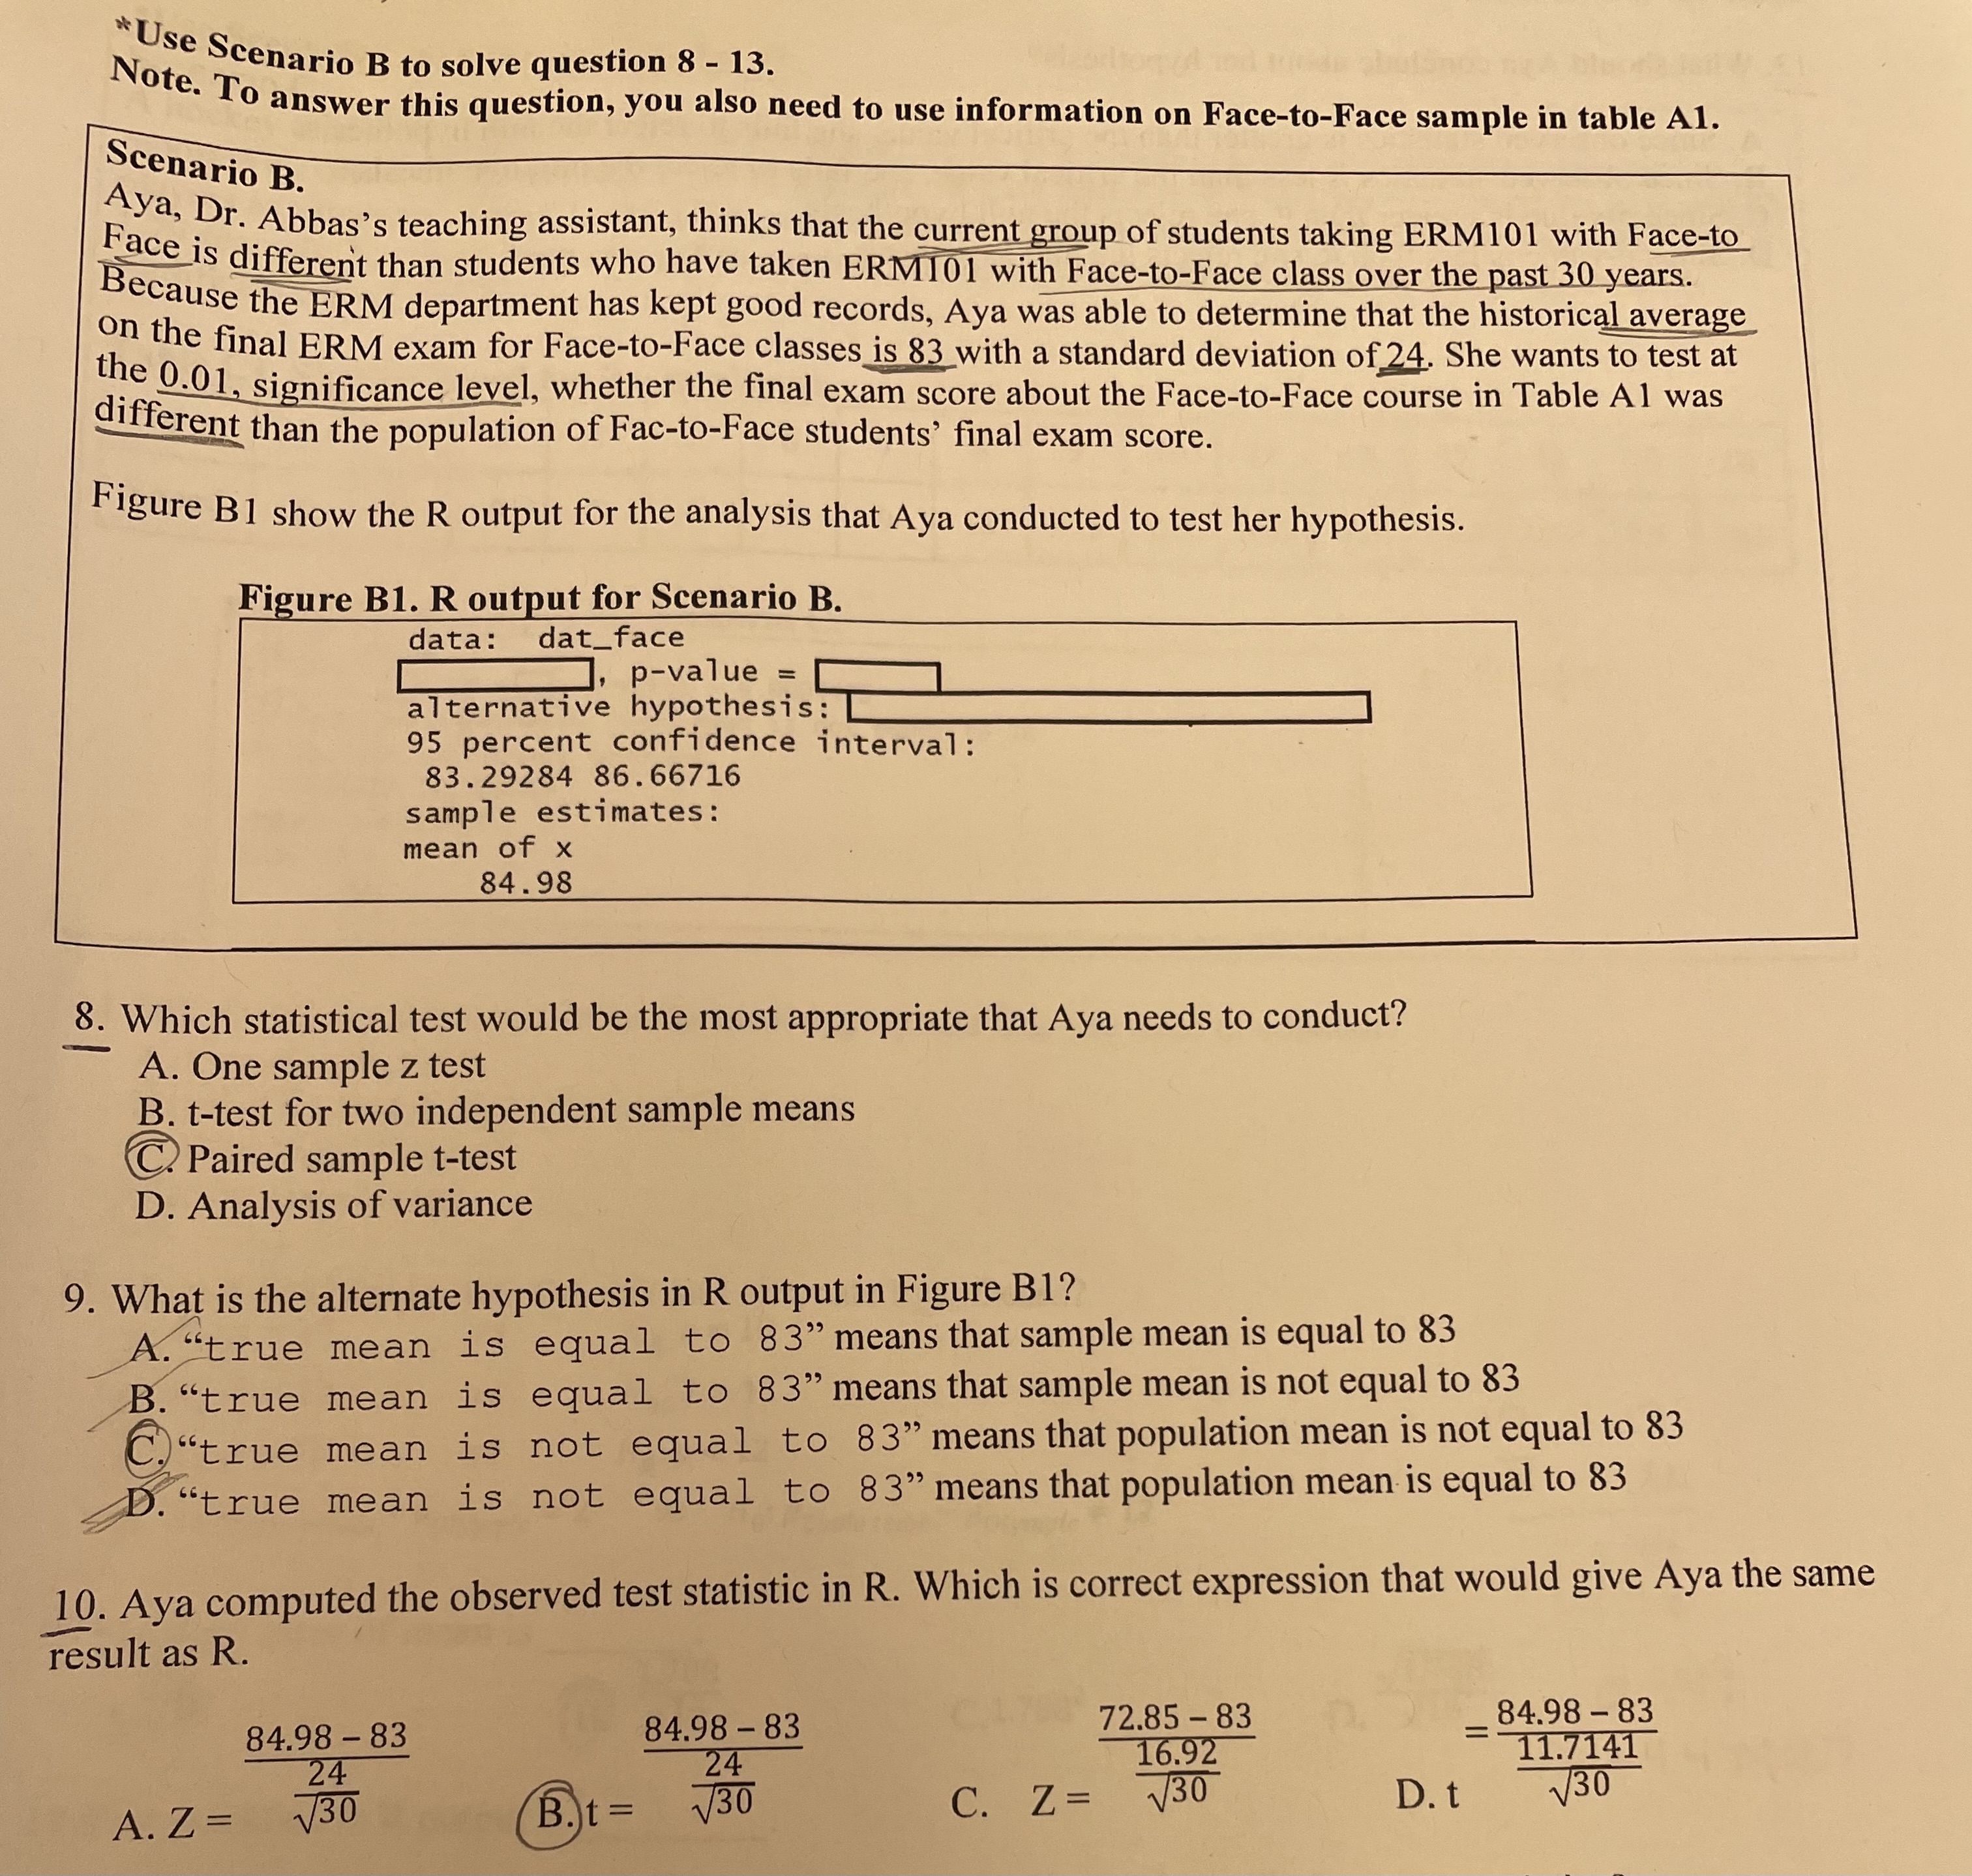
* Use the scenario A for question 1-7. Scenario A. Dr. Abbas, a professor at a large community college, wanted to determine whether there is a difference between students who took her ERM101 course online and the students who took the course face-to-face at the significance level of 0.05. 30 students were randomly assigned to each of the two sections. Table Al below summarizes the data from the final exam he administered to both groups. Table Al. Summary statistics for ERM 101 students' final score. Course Number of Type Mean Standard Variance Minimum Maximum students Deviation Online 30 72.85 16.9187 286.2447 21.0 124.0 Face to 84.98 11.71412 137.2217 48.0 121.0 30 Face* Use Scenario B to solve question 8 - 13. Note. To answer this question, you also need to use information on Face-to-Face sample in table Al. Scenario B. Face is different Aya, Dr. Abbas's teaching assistant, thinks that the current group of students taking ERM101 with Face-to Because the ERMI han students who have taken ERMIOI with Face-to-Face class over the past 30 years. e ERM department has kept good records, Aya was able to determine that the historical average on the final ERM exam for Face-to-Face classes is 83 with a standard deviation of 24. She wants to test at the 0.01, significance level, whether the final exam score about the Face-to-Face course in Table Al was different than the population of Fac-to-Face students' final exam score. Figure BI show the R output for the analysis that Aya conducted to test her hypothesis. Figure B1. R output for Scenario B. data: dat_face , p-value = alternative hypothesis : 95 percent confidence interval: 83. 29284 86. 66716 sample estimates : mean of x 84. 98 8. Which statistical test would be the most appropriate that Aya needs to conduct? A. One sample z test B. t-test for two independent sample means C. Paired sample t-test D. Analysis of variance 9. What is the alternate hypothesis in R output in Figure Bl? A. "true mean is equal to 83" means that sample mean is equal to 83 B. "true mean is equal to 83" means that sample mean is not equal to 83 C. "true mean is not equal to 83" means that population mean is not equal to 83 D. "true mean is not equal to 83" means that population mean is equal to 83 10. Aya computed the observed test statistic in R. Which is correct expression that would give Aya the same result as R. 84.98 - 83 84.98 - 83 72.85 -83 84.98 - 83 24 24 16.92 11.7141 130 C. Z = V30 D. t V30 A. Z = B.t = 130
Step by Step Solution
There are 3 Steps involved in it

Get step-by-step solutions from verified subject matter experts