

Question: Table above is what is used for the problem One of X Company's production machines was badly damaged recently. Unfortunately, the machine was purchased just
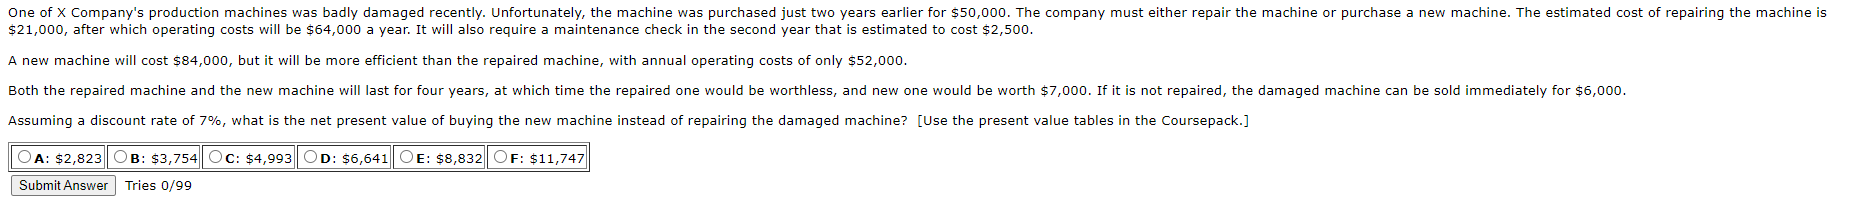
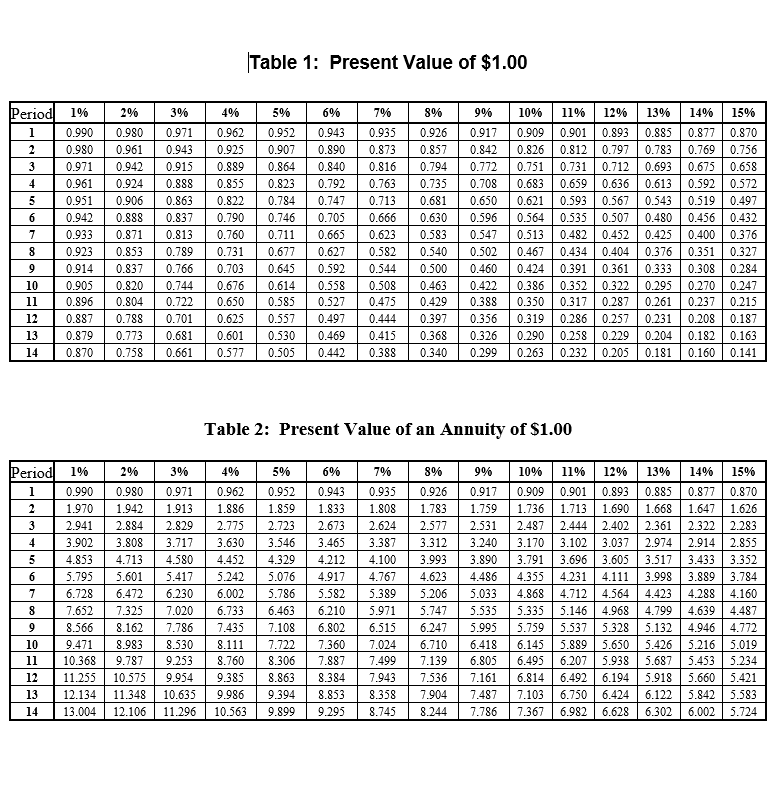
Table above is what is used for the problem
One of X Company's production machines was badly damaged recently. Unfortunately, the machine was purchased just two years earlier for $50,000. The company must either repair the machine or purchase a new machine. The estimated cost of repairing the machine is $21,000, after which operating costs will be $64,000 a year. It will also require a maintenance check in the second year that is estimated to cost $2,500. A new machine will cost $84,000, but it will be more efficient than the repaired machine, with annual operating costs of only $52,000. Both the repaired machine and the new machine will last for four years, at which time the repaired one would be worthless, and new one would be worth $7,000. If it is not repaired, the damaged machine can be sold immediately for $6,000. Assuming a discount rate of 7%, what is the net present value of buying the new machine instead of repairing the damaged machine? [Use the present value tables in the Coursepack.] OA: $2,823 OB: $3,754 Oc: $4,993 OD: $6,641 OE: $8,832 OF: $11,747 Submit Answer Tries 0/99 Table 1: Present Value of $1.00 1% 496 7% 10% Period 1 2 3 5 6 7 8 9 10 11 12 13 14 0.990 0.980 0.971 0.961 0.951 0.942 0.933 0.923 0.914 0.905 0.896 0.887 0.879 0.870 2% 0.980 0.961 0.942 0.924 0.906 0.888 0.871 0.853 0.837 0.820 0.804 0.788 0.773 0.758 3% 0.971 0.943 0.915 0.888 0.863 0.837 0.813 0.789 0.766 0.744 0.722 0.701 0.681 0.661 0.962 0.925 0.889 0.855 0.822 0.790 0.760 0.731 0.703 0.676 0.650 0.625 0.601 0.577 5% 0.952 0.907 0.864 0.823 0.784 0.746 0.711 0.677 0.645 0.614 0.585 0.557 0.530 0.505 6% 0.943 0.890 0.840 0.792 0.747 0.705 0.665 0.627 0.592 0.558 0.527 0.497 0.469 0.442 0.935 0.873 0.816 0.763 0.713 0.666 0.623 0.582 0.544 0.508 0.475 0.444 0.415 0.388 8% 0.926 0.857 0.794 0.735 0.681 0.630 0.583 0.540 0.500 0.463 0.429 0.397 0.368 0.340 9% 0.917 0.842 0.772 0.708 0.650 0.596 0.547 0.502 0.460 0.422 0.388 0.356 0.326 0.299 0.909 0.826 0.751 0.683 0.621 0.564 0.513 0.467 0.424 0.386 0.350 0.319 0.290 0.263 11% 0.901 0.812 0.731 0.659 0.593 0.535 0.482 0.434 0.391 0.352 0.317 0.286 0.258 0.232 12% 0.893 0.797 0.712 0.636 0.567 0.507 0.452 0.404 0.361 0.322 0.287 0.257 0.229 0.205 13% 0.885 0.783 0.693 0.613 0.543 0.480 0.425 0.376 0.333 0.295 0.261 0.231 0.204 0.181 149 15% 0.877 0.870 0.769 0.756 0.675 0.658 0.592 0.572 0.519 0.497 0.456 0.432 0.400 0.376 0.351 0.327 0.308 0.284 0.270 0.247 0.237 0.215 0.208 0.187 0.182 0.163 0.160 0.141 Table 2: Present Value of an Annuity of $1.00 1% 2% 3% 4% 5% 6% 7% 8% 9% 10% 11% 12% 13% Period 1 2 3 4 5 6 7 8 9 10 11 12 13 14 0.990 1.970 2.941 3.902 4.853 5.795 6.728 7.652 8.566 9.471 10.368 11.255 12.134 13.004 0.980 1.942 2.884 3.808 4.713 5.601 6.472 7.325 8.162 8.983 9.787 10.575 11.348 12.106 0.971 1.913 2.829 3.717 4.580 5.417 6.230 7.020 7.786 8.530 9.253 9.954 10.635 11.296 0.962 1.886 2.775 3.630 4.452 5.242 6.002 6.733 7.435 8.111 8.760 9.385 9.986 10.563 0.952 1.859 2.723 3.546 4.329 5.076 5.786 6.463 7.108 7.722 8.306 8.863 9.394 9.899 0.943 1.833 2.673 3.465 4.212 4.917 5.582 6.210 6.802 7.360 7.887 8.384 8.853 9.295 0.935 1.808 2.624 3.387 4.100 4.767 5.389 5.971 6.515 7.024 7.499 7.943 8.358 8.745 0.926 1.783 2.577 3.312 3.993 4.623 5.206 5.747 6.247 6.710 7.139 7.536 7.904 8.244 0.917 1.759 2.531 3.240 3.890 4.486 5.033 5.535 5.995 6.418 6.805 7.161 7.487 7.786 0.909 1.736 2.487 3.170 3.791 4.355 4.868 5.335 5.759 6.145 6.495 6.814 7.103 7.367 0.901 1.713 2.444 3.102 3.696 4.231 4.712 5.146 5.537 5.889 6.207 6.492 6.750 6.982 0.893 1.690 2.402 3.037 3.605 4.111 4.564 4.968 5.328 5.650 5.938 6.194 6.424 6.628 0.885 1.668 2.361 2.974 3.517 3.998 4.423 4.799 5.132 5.426 5.687 5.918 6.122 6.302 14% 15% 0.877 0.870 1.647 1.626 2.322 2.283 2.914 2.855 3.433 3.352 3.889 3.784 4.288 4.160 4.639 4.487 4.946 4.772 5.216 5.019 5.453 5.234 5.660 5.421 5.842 5.583 6.002 5.724
Step by Step Solution
There are 3 Steps involved in it

Get step-by-step solutions from verified subject matter experts