

Question: Table b. Compute the variance and standard deviation for each of the assets from 1929 to 1940. The variance for the S&P 500 was I.
Table
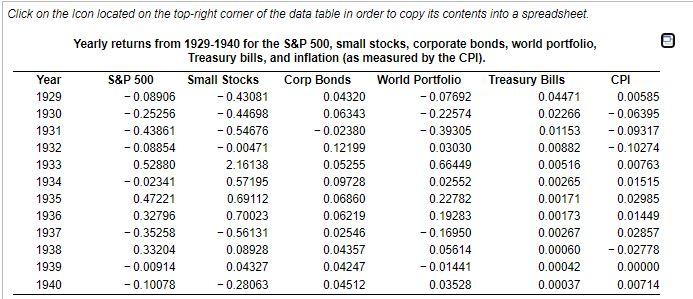
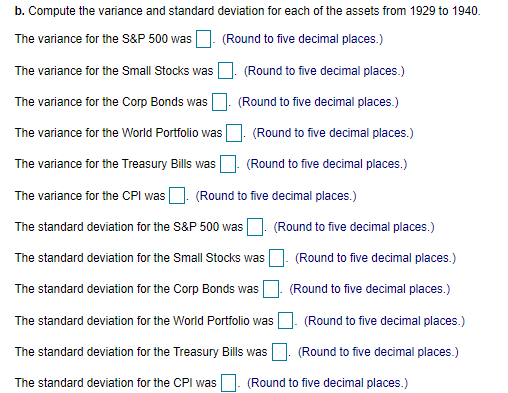
b. Compute the variance and standard deviation for each of the assets from 1929 to 1940. The variance for the S&P 500 was I. (Round to five decimal places.) The variance for the Small Stocks was I. (Round to five decimal places.) The variance for the Corp Bonds was (Round to five decimal places.) The variance for the World Portfolio was (Round to five decimal places.) The variance for the Treasury Bills was (Round to five decimal places.) The variance for the CPI was I. (Round to five decimal places.) The standard deviation for the S&P 500 was (Round to five decimal places.) The standard deviation for the Small Stocks was (Round to five decimal places.) The standard deviation for the Corp Bonds was (Round to five decimal places.) The standard deviation for the World Portfolio was (Round to five decimal places.) The standard deviation for the Treasury Bills was (Round to five decimal places.) The standard deviation for the CPI was (Round to five decimal places.) Click on the Icon located on the top-right corner of the data table in order to copy its contents into a spreadsheet. Year 1929 1930 1931 1932 1933 1934 1935 1936 1937 1938 1939 1940 Yearly returns from 1929-1940 for the S&P 500, small stocks, corporate bonds, world portfolio, Treasury bills, and inflation (as measured by the CPI). S&P 500 Small Stocks Corp Bonds World Portfolio Treasury Bills -0.08906 -0.43081 0.04320 -0.07692 0.04471 -0.25256 -0.44698 0.06343 -0.22574 0.02266 -0.43861 -0.54676 -0.02380 -0.39305 0.01153 -0.08854 -0.00471 0.12199 0.03030 0.00882 0.52880 2.16138 0.05255 0.66449 0.00516 -0.02341 0.57195 0.09728 0.02552 0.00265 0.47221 0.69112 0.06860 0.22782 0.00171 0.32796 0.70023 0.06219 0.19283 0.00173 -0.35258 -0.56131 0.02546 -0.16950 0.00267 0.33204 0.08928 0.04357 0.05614 0.00060 -0.00914 0.04327 0.04247 -0.01441 0.00042 -0.10078 -0.28063 0.04512 0.03528 0.00037 CPI 0.00585 -0.06395 -0.09317 -0.10274 0.00763 0.01515 0.02985 0.01449 0.02857 -0.02778 0.00000 0.00714 b. Compute the variance and standard deviation for each of the assets from 1929 to 1940. The variance for the S&P 500 was I. (Round to five decimal places.) The variance for the Small Stocks was I. (Round to five decimal places.) The variance for the Corp Bonds was (Round to five decimal places.) The variance for the World Portfolio was (Round to five decimal places.) The variance for the Treasury Bills was (Round to five decimal places.) The variance for the CPI was I. (Round to five decimal places.) The standard deviation for the S&P 500 was (Round to five decimal places.) The standard deviation for the Small Stocks was (Round to five decimal places.) The standard deviation for the Corp Bonds was (Round to five decimal places.) The standard deviation for the World Portfolio was (Round to five decimal places.) The standard deviation for the Treasury Bills was (Round to five decimal places.) The standard deviation for the CPI was (Round to five decimal places.) Click on the Icon located on the top-right corner of the data table in order to copy its contents into a spreadsheet. Year 1929 1930 1931 1932 1933 1934 1935 1936 1937 1938 1939 1940 Yearly returns from 1929-1940 for the S&P 500, small stocks, corporate bonds, world portfolio, Treasury bills, and inflation (as measured by the CPI). S&P 500 Small Stocks Corp Bonds World Portfolio Treasury Bills -0.08906 -0.43081 0.04320 -0.07692 0.04471 -0.25256 -0.44698 0.06343 -0.22574 0.02266 -0.43861 -0.54676 -0.02380 -0.39305 0.01153 -0.08854 -0.00471 0.12199 0.03030 0.00882 0.52880 2.16138 0.05255 0.66449 0.00516 -0.02341 0.57195 0.09728 0.02552 0.00265 0.47221 0.69112 0.06860 0.22782 0.00171 0.32796 0.70023 0.06219 0.19283 0.00173 -0.35258 -0.56131 0.02546 -0.16950 0.00267 0.33204 0.08928 0.04357 0.05614 0.00060 -0.00914 0.04327 0.04247 -0.01441 0.00042 -0.10078 -0.28063 0.04512 0.03528 0.00037 CPI 0.00585 -0.06395 -0.09317 -0.10274 0.00763 0.01515 0.02985 0.01449 0.02857 -0.02778 0.00000 0.00714
Step by Step Solution
There are 3 Steps involved in it

Get step-by-step solutions from verified subject matter experts