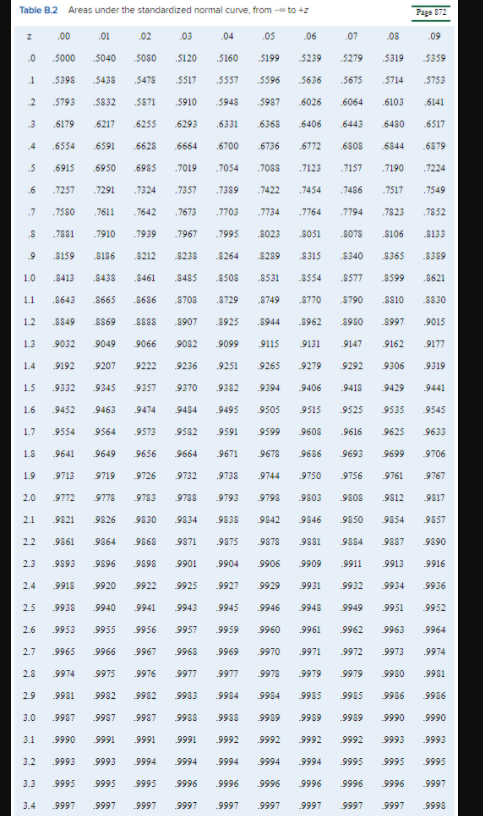
Question: Table B.2 Areas under the standardized normal curve, from - to z Page 372 Z .00 .01 .02 .03 .04 .05 .06 .07 .08 .09

Table B.2 Areas under the standardized normalTable B.2 Areas under the standardized normal

Table B.2 Areas under the standardized normal curve, from - to z Page 372 Z .00 .01 .02 .03 .04 .05 .06 .07 .08 .09 0 .5000 5040 5080 5120 5160 5199 5239 5279 5319 .5359 1 .5398 5438 5478 5517 5357 5596 5636 .5675 5714 5753 2 5793 5832 .5871 5910 5948 5987 .6026 6064 6103 6141 3 .6179 .6217 .6255 .6293 .6331 6368 .6406 6443 .6480 6517 4 .6354 .6591 .6628 6664 .6700 .6736 .6772 6808 .6844 .6879 5 .6915 6950 .6985 .7019 .7054 7088 7123 .7157 .7190 .7224 .6 .7257 .7291 .7324 .7357 7389 .7422 .7454 .7486 .7517 .7549 .7 .7580 .7611 .7642 7673 7703 .7734 .7764 7794 .7823 .7852 8 .7881 .7910 .7939 .7967 7995 8023 .8051 8078 .8106 .8133 9 .8159 8186 .8212 8238 .8264 8289 8315 8340 8365 .8389 1.0 .8413 8438 3461 8485 8508 8531 .8354 .8577 8599 .8621 1.1 .8643 .8665 .8686 8708 .8729 8749 .8770 8790 SS10 .8830 1.2 .8849 8869 .8888 8907 8925 9944 8962 8950 9997 9015 1.3 .9032 .9049 .9066 9082 9099 9115 9131 9147 9162 9177 1.4 .9192 9207 9222 9236 .9251 9265 .9279 9292 9306 9319 1.5 .9332 9345 9357 9370 .9382 9394 9406 .9418 9429 .9441 1.6 .9452 9463 .9474 9484 9495 9505 9515 9525 9535 9545 1.7 .9554 9564 .9573 9582 .9591 9599 9608 .9616 9625 .9633 1.8 9641 9649 .9656 9664 .9671 9678 9686 9693 9699 9706 1.9 9713 9719 9726 9732 .9738 9744 9750 9756 9761 9767 2.0 9772 9778 9783 9788 .9793 9798 9803 9808 9812 9817 2.1 9821 9826 .9830 9834 9838 9842 9846 9850 9854 9857 2.2 9861 9864 9868 .9871 .9875 9878 .9881 9884 9887 9890 2.3 9893 .9896 .9898 9901 .9904 9906 9909 9911 9913 .9916 2.4 .9918 .9920 .9922 9925 .9927 9929 .9931 9932 9934 -9936 2.5 .9938 .9940 .9941 9943 9945 9946 .9948 9949 .9951 .9952 2.6 .9953 .9955 9956 9957 .9959 .9960 .9961 9962 9963 -9964 2.7 .9965 .9966 9967 9968 .9969 9970 .9971 .9972 .9973 .9974 2.8 9974 9975 .9976 9977 .9977 9978 9979 .9979 9930 .9981 2.9 9981 .9982 .9982 9983 .9984 9984 -9985 9985 9936 .9986 3.0 .9987 9987 .9987 9988 9988 9989 9989 .9989 9990 .9990 3.1 .9990 9991 .9991 .9991 .9992 .9992 9992 .9992 9993 .9993 3.2 .9993 .9993 .9994 9994 .9994 9994 9994 .9995 9995 9995 3.3 .9995 -9995 .9995 9996 -9996 9996 -9996 9996 9996 .9997 .9997 .9997 .9997 9997 -9997 9997 9997 .9997 9997 9998 Suppose that the manager of a construction supply house determined from historical records that demand for sand averages 49 tons. In addition, suppose the manager determined that demand during lead time could be described by a normal distribution that has a mean of 49 and a standard deviation of 6 tons. Answer the following questions assuming that the manager is willing to accept a stockout risk of no more than 3 percent. Use Table B.2 (Round your answer to two decimal points.) a. What value of z is appropriate? Z-Value b. How much safety stock should be held? (Round your answer to two decimal points.) Safety Stock c. What reorder point should be used? (Round your answer to two decimal points.) Reorder Point

Step by Step Solution

There are 3 Steps involved in it

1 Expert Approved Answer
Step: 1 Unlock blur-text-image
Question Has Been Solved by an Expert!

Get step-by-step solutions from verified subject matter experts

Step: 2 Unlock
Step: 3 Unlock

Students Have Also Explored These Related General Management Questions!