

Table B.4 presents data for 27 houses sold in Erie, Pennsylvania. a. Fit a simple linear regression
Fantastic news! We've Found the answer you've been seeking!
Question:
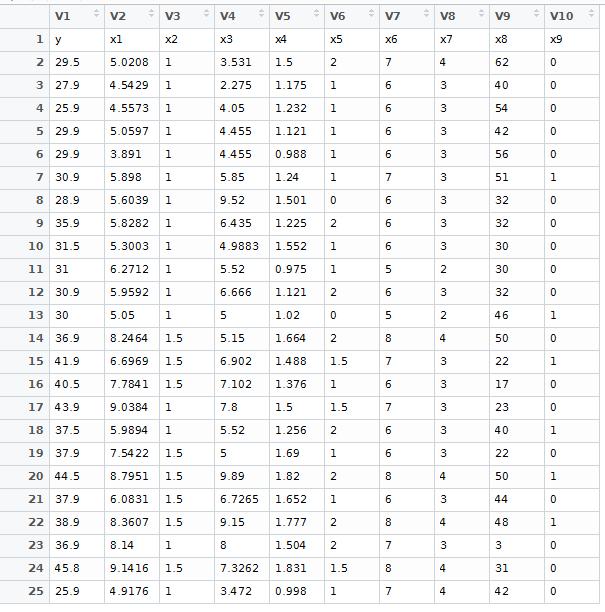
Table B.4 presents data for 27 houses sold in Erie, Pennsylvania.
a. Fit a simple linear regression model relating selling price of the house to the current taxes ( x1 ).
b. Test for signifi cance of regression.
c. What percent of the total variability in selling price is explained by this model?
d. Find a 95% CI on β1 .
(a) Do part (a). Report your point estimates for all parameters of your model. Make a plot of the data and the fitted regression line.
(b) Do part (b) which asks you to run and interpret an F test.
(c) Part (c) asks you to interpret the sums-of-squares decomposition. Answer this question.
(d) Do part (d).
Expert Answer:
Solution a Construct the simple linear regression model by using MINITAB MINITA... View the full answer

Related Book For 

Statistics for Business and Economics
ISBN: 978-0321826237
12th edition
Authors: James T. McClave, P. George Benson, Terry T Sincich
Posted Date:
