

Question: Table below shows the demand schedule for poetry booklets in the town of Never Ending. Price 20 18 16 14 12 10 8 6
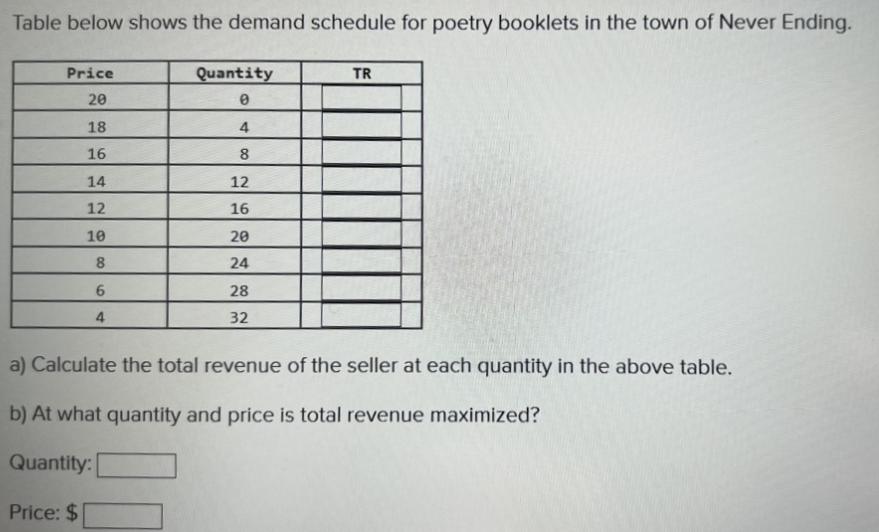
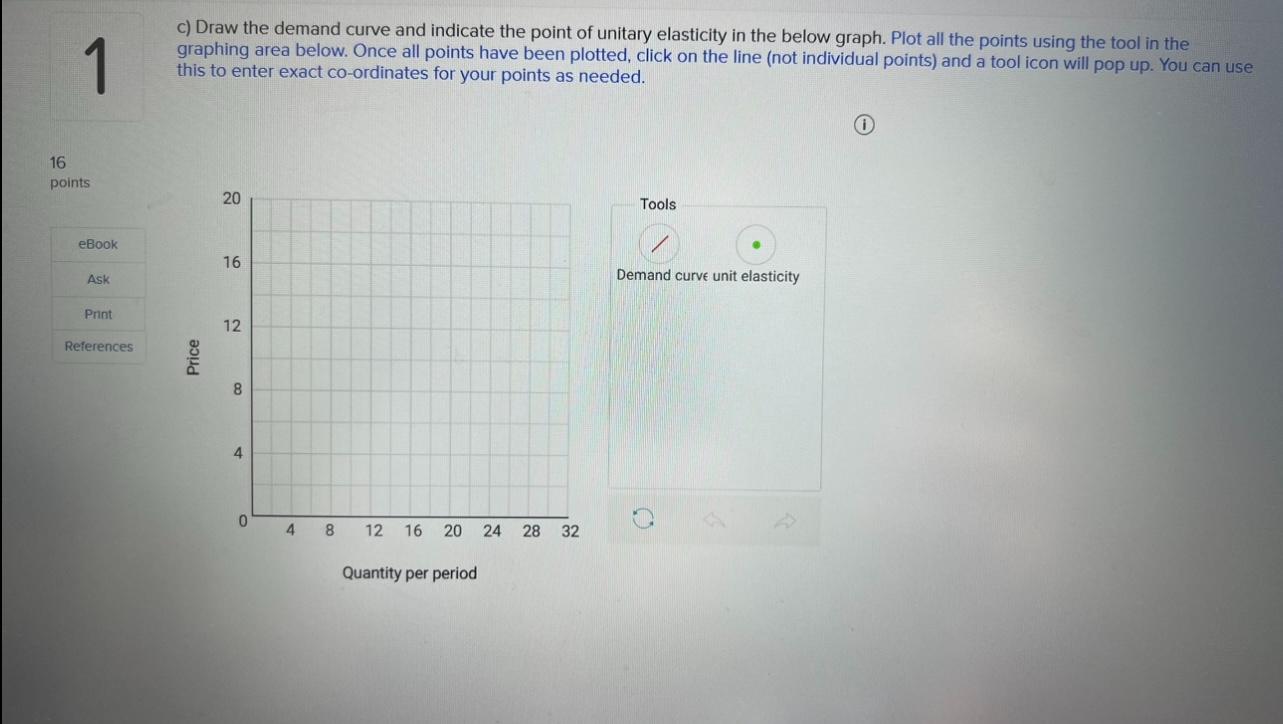
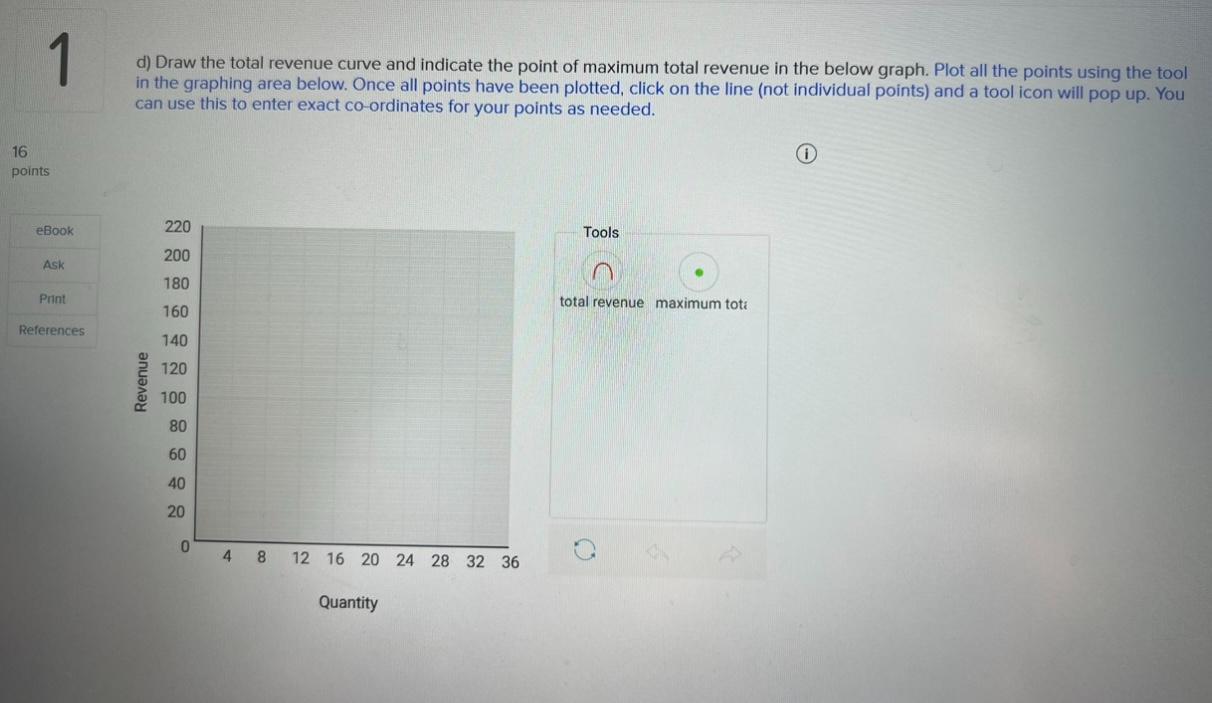
Table below shows the demand schedule for poetry booklets in the town of Never Ending. Price 20 18 16 14 12 10 8 6 4 Price: $ Quantity 0 4 8 12 16 20 24 28 32 TR a) Calculate the total revenue of the seller at each quantity in the above table. b) At what quantity and price is total revenue maximized? Quantity: 1 c) Draw the demand curve and indicate the point of unitary elasticity in the below graph. Plot all the points using the tool in the graphing area below. Once all points have been plotted, click on the line (not individual points) and a tool icon will pop up. You can use this to enter exact co-ordinates for your points as needed. 16 points eBook Ask Print References Price 20 16 12 8 4 0 4 8 12 16 20 24 28 32 Quantity per period Tools / Demand curve unit elasticity 1 d) Draw the total revenue curve and indicate the point of maximum total revenue in the below graph. Plot all the points using the tool in the graphing area below. Once all points have been plotted, click on the line (not individual points) and a tool icon will pop up. You can use this to enter exact co-ordinates for your points as needed. 16 points eBook Ask Print References Revenue 220 200 180 160 140 120 100 80 60 40 20 0 4 8 12 16 20 24 28 32 36 Quantity Tools total revenue maximum tota O
Step by Step Solution
There are 3 Steps involved in it
PRICE QUANTITY TOTAL REVENUE PRICE QUANT... View full answer

Get step-by-step solutions from verified subject matter experts