

Question: Table below shows the Mild Steel thickness collected randomly from the CNC Machine. During the Measure phase, they collected 20 sets of plate thickness
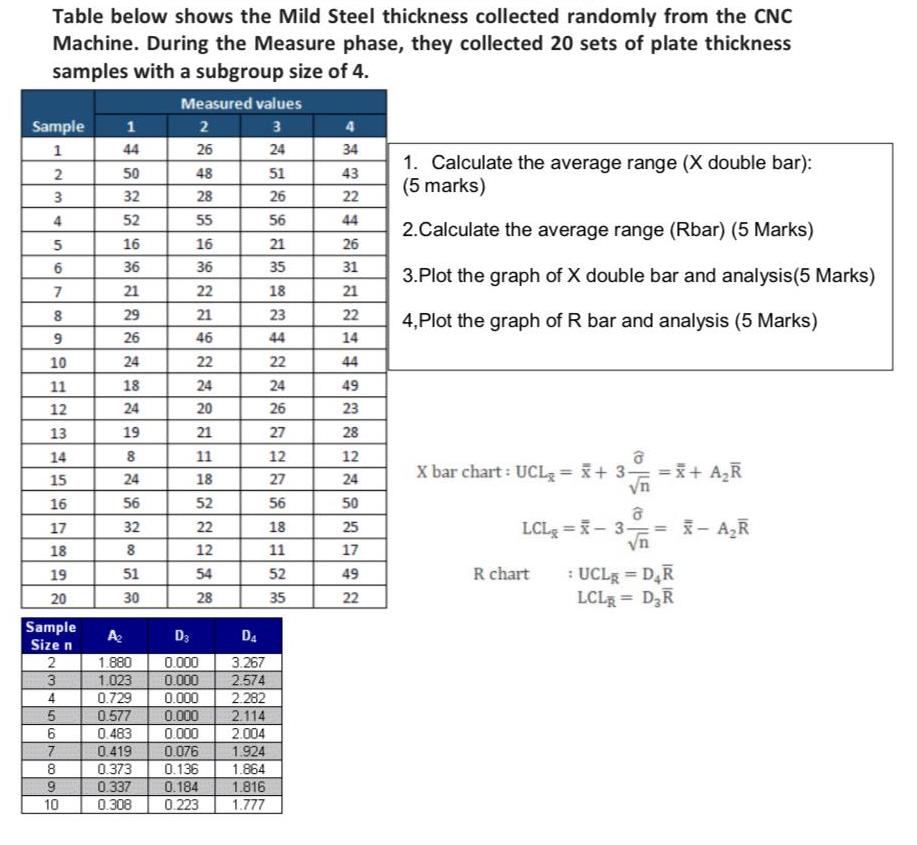
Table below shows the Mild Steel thickness collected randomly from the CNC Machine. During the Measure phase, they collected 20 sets of plate thickness samples with a subgroup size of 4. Sample 1 1 44 2 3 4 5 678 9 10 11 12 13 14 15 16 17 18 19 20 Sample Size n 23456N09 7 8 10 50 32 52 16 36 21 29 26 24 18 2200 24 19 8 24 56 32 8 51 30 Measured values 3 24 51 26 56 21 35 2 26 48 28 55 16 36 22 21 46 22 24 20 21 11 18 52 22 12 54 28 D4 3.267 2.574 A D3 1.880 0.000 1.023 0.000 0.729 0.000 0.577 0.000 0.483 0.000 0.419 0.076 0.373 0.136 0.337 0.184 0.308 0.223 1.777 18 23 44 22 24 26 27 12 27 56 18 11 52 35 2.282 2.114 2.004 1.924 1.864 1.816 4 34 43 NECKEN 22 44 26 31 21 22 14 44 49 23 28 12 283692 24 50 25 17 49 1. Calculate the average range (X double bar): (5 marks) 2.Calculate the average range (Rbar) (5 Marks) 3.Plot the graph of X double bar and analysis (5 Marks) 4,Plot the graph of R bar and analysis (5 Marks) X bar chart: UCL = x + 3- LCL = - 3 10 LE 10 R chart n =X+ AR 11 = X-AR : UCL = DAR LCLR = DR
Step by Step Solution
3.34 Rating (163 Votes )
There are 3 Steps involved in it
This image displays a set of instructions for a statistical quality control exercise including a dat... View full answer

Get step-by-step solutions from verified subject matter experts