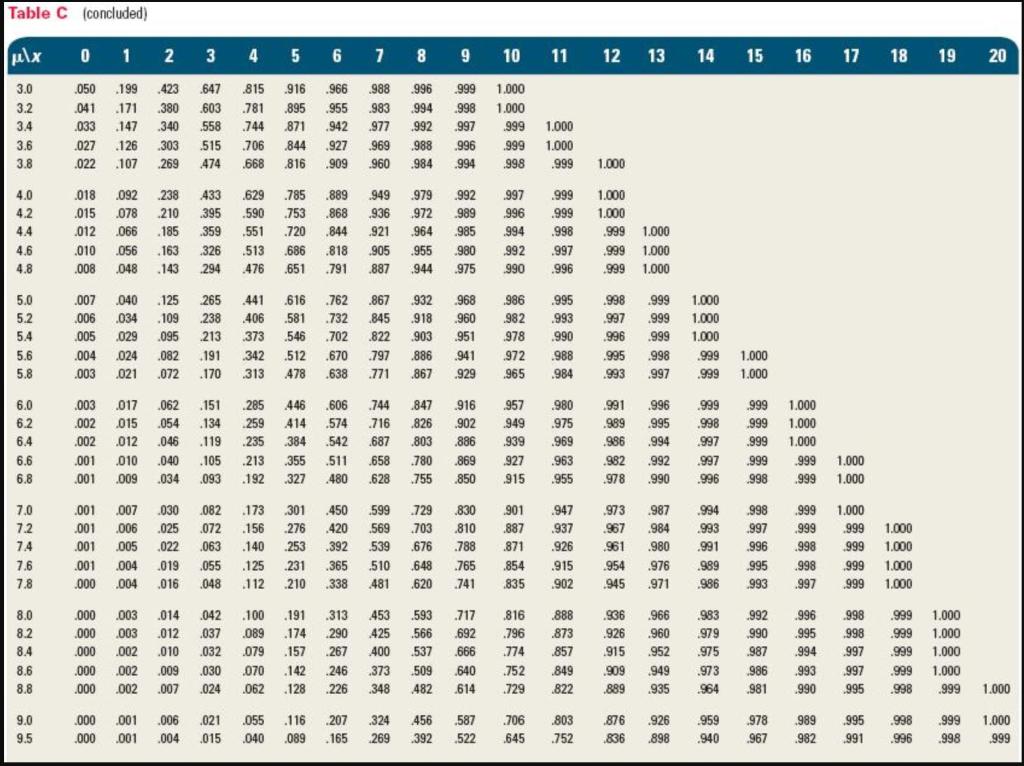
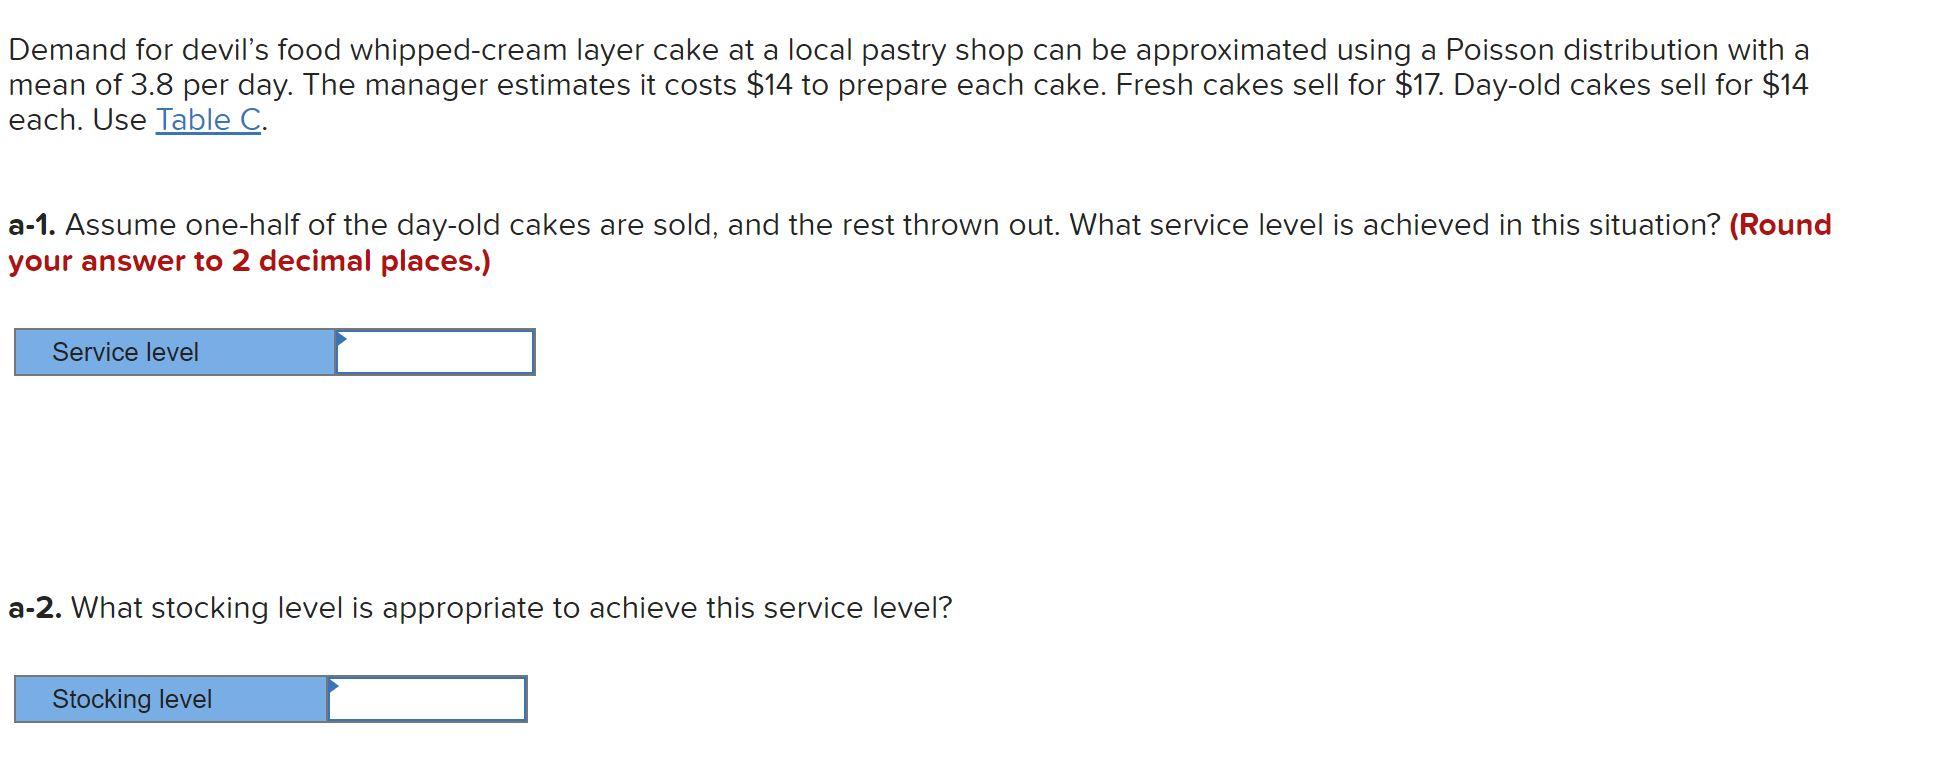
Question: Table C (concluded) ulx 14 15 16 17 18 19 20 3.0 3.2 3.4 3.6 3.8 0 1 2 3 4 5 6 7 8

Table C (concluded) ulx 14 15 16 17 18 19 20 3.0

Table C (concluded) ulx 14 15 16 17 18 19 20 3.0

Table C (concluded) ulx 14 15 16 17 18 19 20 3.0 3.2 3.4 3.6 3.8 0 1 2 3 4 5 6 7 8 9 10 11 12 13 .050 199423 647 .815 916 966 988 996 999 1.000 .041 171 380 .603 781 895 .955 983 .994 998 1.000 .033.147 340 .558 .744 871 942 977 .992 997 .999 1.000 .027 126 303 .515 .706 844 927 969 .988 .996 .999 1.000 .022 107 269 .474 .668 816 909 960 .984 .994 1998 .999 1.000 4.0 42 4.4 4,6 4.8 .018 .092 238 .015.078 210 .012 066 185 .010 .056 163 .008 .048 143 433 .395 359 326 .294 .629.785 .590 753 .551 720 .513 .686 .476 651 .889 .949 .868 .936 .844 .921 .818 .905 .791 887 .979 .972 .964 .955 .944 .992 .989 .985 .980 .975 .997 .996 .994 1992 990 .999 .999 .998 .997 .996 1.000 1.000 .999 1.000 .999 1.000 .999 1.000 5.0 52 5.4 5.6 5.8 .007 .040 125 ,006 .034 109 005.029 095 .004 .024.082 ,003.021 .072 265 .441 616 .762867 932 .968 .238 .406 .581 .732 .845 .918 .960 213.373 546 702 822 903 951 .191 .342.512.670 797 .886 .941 .170 .313 478 638 771 .867929 .986 .982 978 .972 .965 .995 .993 .990 .988 .984 .998 .999 1.000 .997.999 1.000 .996 999 1.000 .995 998 .999 1.000 .993 997 .999 1.000 6.0 6.2 6.4 6.6 6.8 .003 .017.062 .002.015.054 .002.012.046 .001 .010.040 .001.009.034 .151 .134 .119 .105 .093 .285 .446 .606 .744 259 414 .574 .716 .235 384 .542 687 .213.355 511 .658 .192 327 .480.628 .847 .826 .803 .780 .755 .916 902 .886 .869 .850 957 .949 939 .927 .915 .980 .975 .969 .963 .955 .991 .989 986 .982 .978 .996 .995 .994 .992 .990 .999 .998 .997 .997 .996 .999 1.000 .999 1.000 .999 1.000 .999 .999 1.000 1998 .999 1.000 7.0 7.2 7.4 7.6 7.8 .001.007.030 082 .173 301 .450 599 .001.006.025 .072.156 276 .420 .569 .001.005.022.063.140.253.392 539 .001.004 .019 .055.125.231 365 510 .000.004 .016 .048 112 210 .338 481 .729 .830 .703 .810 .676 .788 .648 .765 620 741 .901 .887 .871 .854 835 .947 937 .926 .915 .902 .973 .987 967 .984 961 .980 .954 .976 .945.971 .994 .993 .991 .989 .986 .998 997 .996 .995 993 .999 1.000 .999 .999 1.000 .998 .999 1.000 .998 .999 1.000 .997 .999 1.000 8.0 8.2 8.4 8.6 8.8 .000.003.014 .042 .100 191 .313 453 .000.003 .012 .037.089.174 290 .425 .000 .02 .010.032.079.157 .267 .400 .000 .002.009 .030 070.142 .246 373 .000 .002 .007.024.062 128 .226 348 .593 .566 .537 509 482 .717 692 .666 .640 .614 .816 .796 774 .752 729 .888 .873 .857 .849 .822 .936 .966 .926 .960 915952 909 949 .889 .935 .983 .979 .975 .992 990 .987 986 .981 .996 .995 .994 .993 .990 .998 .998 .997 .997 .995 .999 1.000 999 1.000 999 1.000 .999 1.000 .998 .999 1.000 .973 .964 9.0 9.5 .000 .001.006 .000 .001.004 ,021 .055 116 015.040 089 .207 .165 .324 .269 456 .392 .587 .522 .706 .645 .803 .752 .876 .836 .926 .898 .959 .940 1978 .967 989 .982 .995 991 .998 .996 .999 1.000 .998 .999 Demand for devil's food whipped-cream layer cake at a local pastry shop can be approximated using a Poisson distribution with a mean of 3.8 per day. The manager estimates it costs $14 to prepare each cake. Fresh cakes sell for $17. Day-old cakes sell for $14 each. Use Table C. a-1. Assume one-half of the day-old cakes are sold, and the rest thrown out. What service level is achieved in this situation? (Round your answer to 2 decimal places.) Service level a-2. What stocking level is appropriate to achieve this service level? Stocking level

Step by Step Solution

There are 3 Steps involved in it

1 Expert Approved Answer
Step: 1 Unlock blur-text-image
Question Has Been Solved by an Expert!

Get step-by-step solutions from verified subject matter experts

Step: 2 Unlock
Step: 3 Unlock

Students Have Also Explored These Related General Management Questions!