

Question: Table Chart Text Media Comment Collaborate Shape In-class activity # 7 - Inventory Errors Whole Foods Grocery reported the following comparative income statement for the
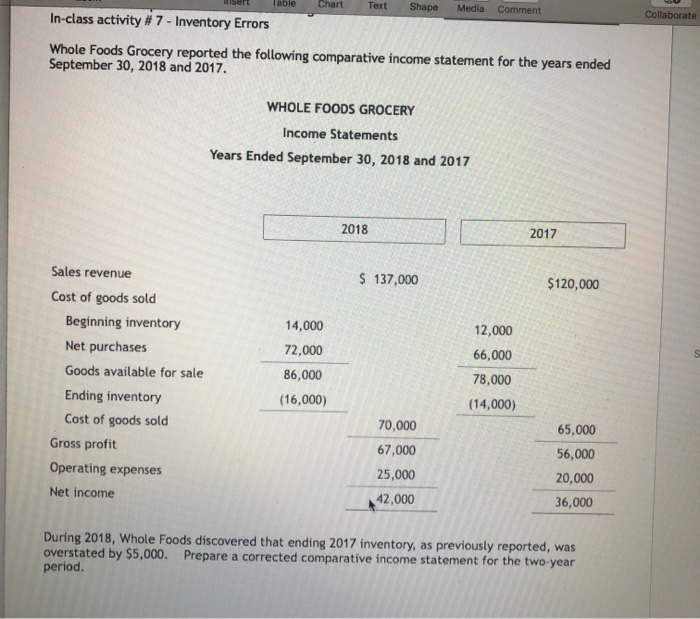
Table Chart Text Media Comment Collaborate Shape In-class activity # 7 - Inventory Errors Whole Foods Grocery reported the following comparative income statement for the years ended September 30, 2018 and 2017. WHOLE FOODS GROCERY Income Statements Years Ended September 30, 2018 and 2017 2018 2017 $ 137,000 $120,000 Sales revenue Cost of goods sold Beginning inventory Net purchases Goods available for sale Ending inventory Cost of goods sold Gross profit Operating expenses Net income 14,000 72,000 86,000 (16,000) 12,000 66,000 78,000 (14,000) 70,000 67,000 25,000 42,000 65,000 56,000 20,000 36,000 During 2018, Whole Foods discovered that ending 2017 inventory, as previously reported, was overstated by $5,000. Prepare a corrected comparative income statement for the two-year period
Step by Step Solution
There are 3 Steps involved in it

Get step-by-step solutions from verified subject matter experts