

Question: table contains the data from five samples, each sample consisting of eight random observations. Click the icon to view the table with sample data. Click
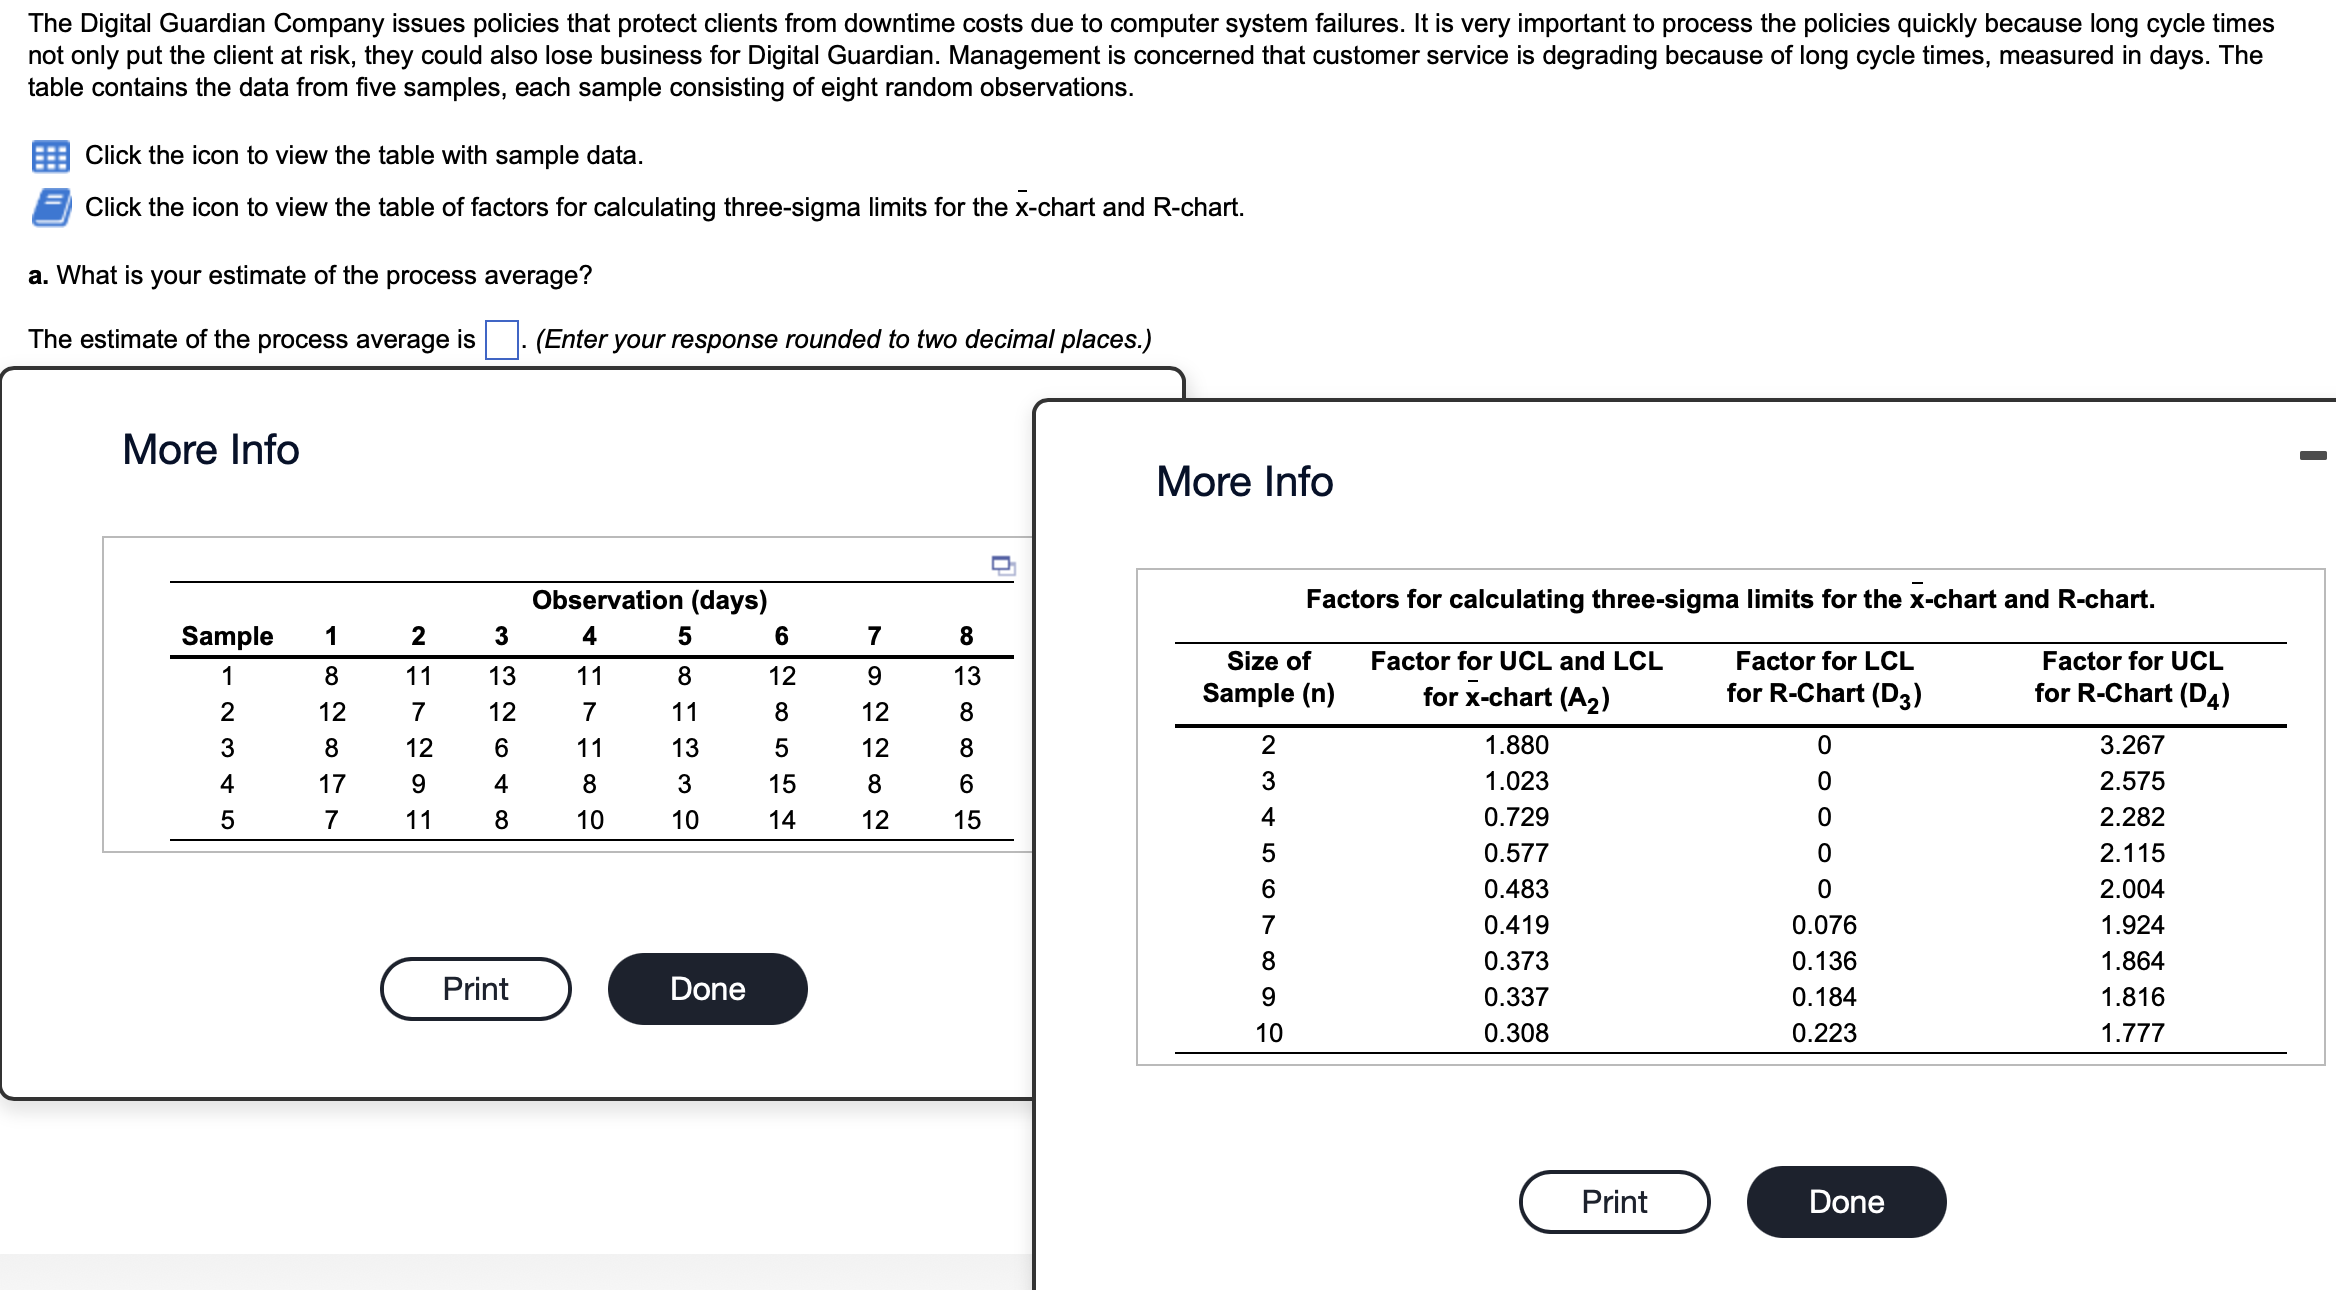
table contains the data from five samples, each sample consisting of eight random observations. Click the icon to view the table with sample data. Click the icon to view the table of factors for calculating three-sigma limits for the x-chart and R-chart. a. What is your estimate of the process average? The estimate of the process average is (Enter your response rounded to two decimal places.) More Info More Info table contains the data from five samples, each sample consisting of eight random observations. Click the icon to view the table with sample data. Click the icon to view the table of factors for calculating three-sigma limits for the x-chart and R-chart. a. What is your estimate of the process average? The estimate of the process average is (Enter your response rounded to two decimal places.) More Info More Info
Step by Step Solution
There are 3 Steps involved in it

Get step-by-step solutions from verified subject matter experts