

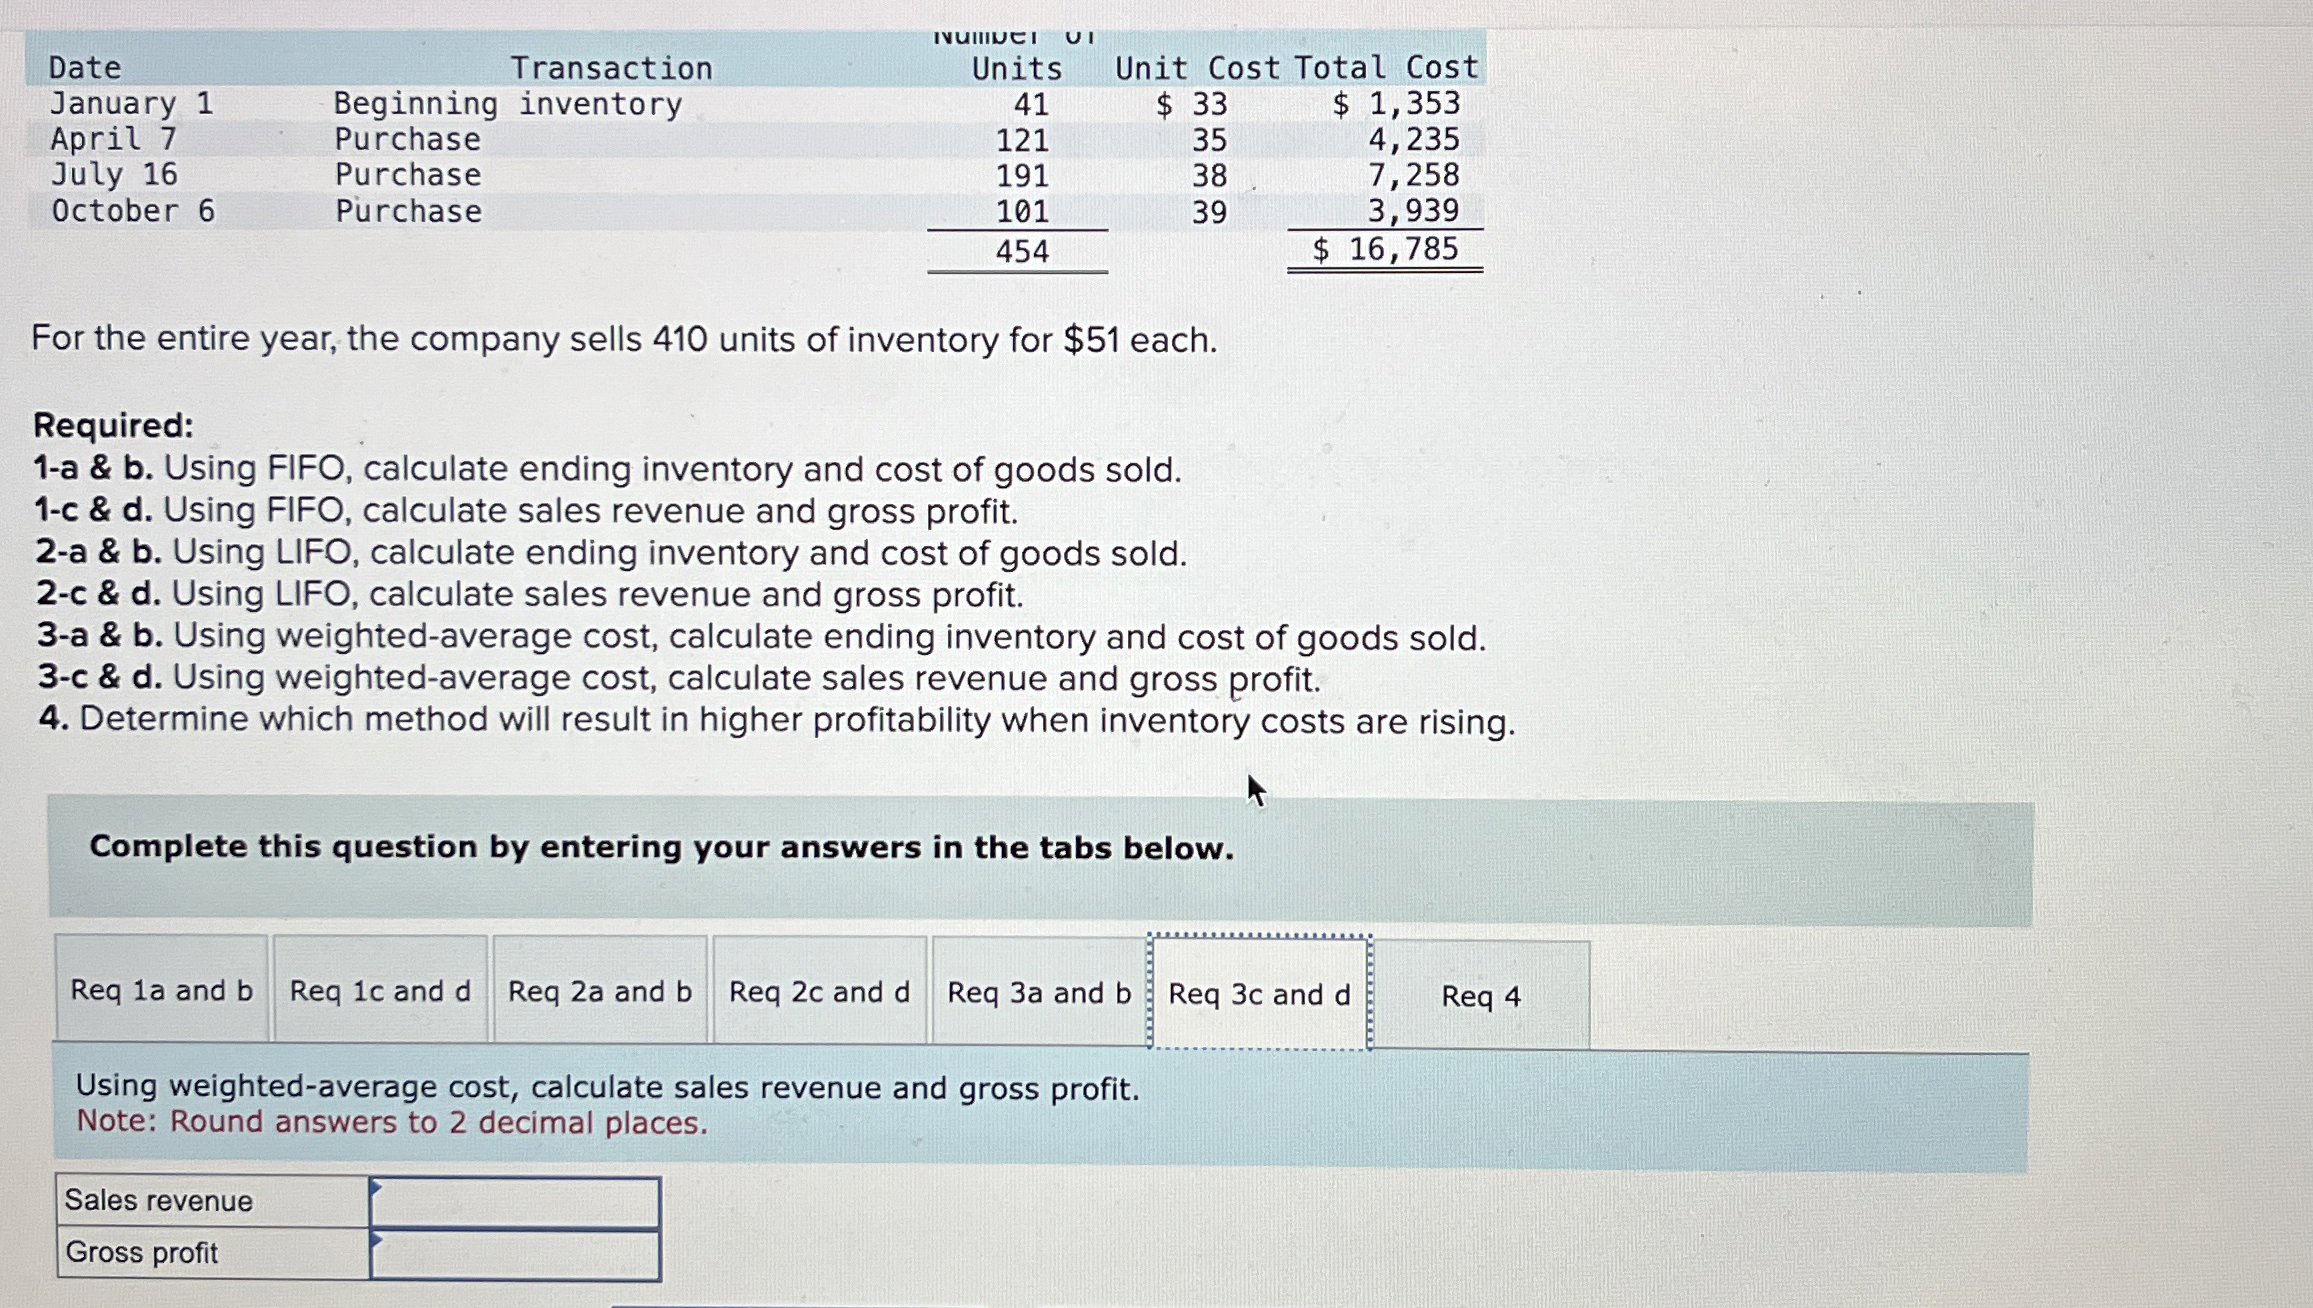
Question: table [ [ Date , Transaction,Units,Unit Cost,Total Cost ] , [ January 1 , Beginning inventory, 4 1 , $ 3 3 , $
tableDateTransaction,Units,Unit Cost,Total CostJanuary Beginning inventory,$ $ April Purchase,July Purchase,October Purchase,$
For the entire year, the company sells units of inventory for $ each.
Required:
a & b Using FIFO, calculate ending inventory and cost of goods sold.
c & d Using FIFO, calculate sales revenue and gross profit.
a & b Using LIFO, calculate ending inventory and cost of goods sold.
c & d Using LIFO, calculate sales revenue and gross profit.
a & b Using weightedaverage cost, calculate ending inventory and cost of goods sold.
c & d Using weightedaverage cost, calculate sales revenue and gross profit.
Determine which method will result in higher profitability when inventory costs are rising.
Complete this question by entering your answers in the tabs below.
Req a and b
Req c and d
Req a and
Req c and d
Req a and b
Req and d
Req
Using weightedaverage cost, calculate sales revenue and gross profit.
Note: Round answers to decimal places.
Sales revenue
Gross profit
Step by Step Solution
There are 3 Steps involved in it
1 Expert Approved Answer
Step: 1 Unlock

Question Has Been Solved by an Expert!
Get step-by-step solutions from verified subject matter experts
Step: 2 Unlock
Step: 3 Unlock