

Question: TABLE I Kitchen Electrics Sales Patterns and Projections (individual units) Product Type 1. Irons 2. Coffeemakers 3. Toasters 4. Blenders 5. Can Openers 6. Mixers
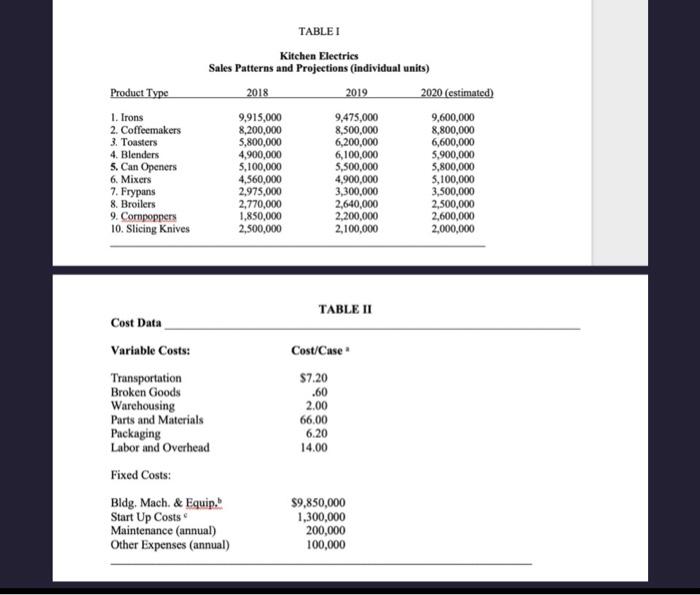

TABLE I Kitchen Electrics Sales Patterns and Projections (individual units) Product Type 1. Irons 2. Coffeemakers 3. Toasters 4. Blenders 5. Can Openers 6. Mixers 7. Frypans 8. Broilers 9. Compoppers 10. Slicing Knives 2018 9,915,000 8,200,000 5,800,000 4,900,000 5,100,000 4,560,000 2,975,000 2,770,000 1,850,000 2019 2020 (estimated) 9,475,000 9,600,000 8,800,000 6,600,000 5,900,000 5,800,000 5,100,000 3,500,000 2,500,000 2,600,000 2,000,000 TABLE II Cost Data Variable Costs: Transportation Broken Goods Warchousing Parts and Materials Packaging Labor and Overhead Cost/Case * $7.20 .60 2.00 66.00 6.20 14.00 Fixed Costs: Bldg. Mach. \& Equip, b Start Up Costs c $9,850,000 Maintenance (annual) 1,300,000 Other Expenses (annual) 200,000 100,000 2) (What is the breakeven in dollars
Step by Step Solution
There are 3 Steps involved in it

Get step-by-step solutions from verified subject matter experts