

Question: Table is as follows Sample Size, n Mean Factor, A2 Upper Range, D4 Lower Range, D3 2 1.880 3.268 0 3 1.023 2.574 0 4
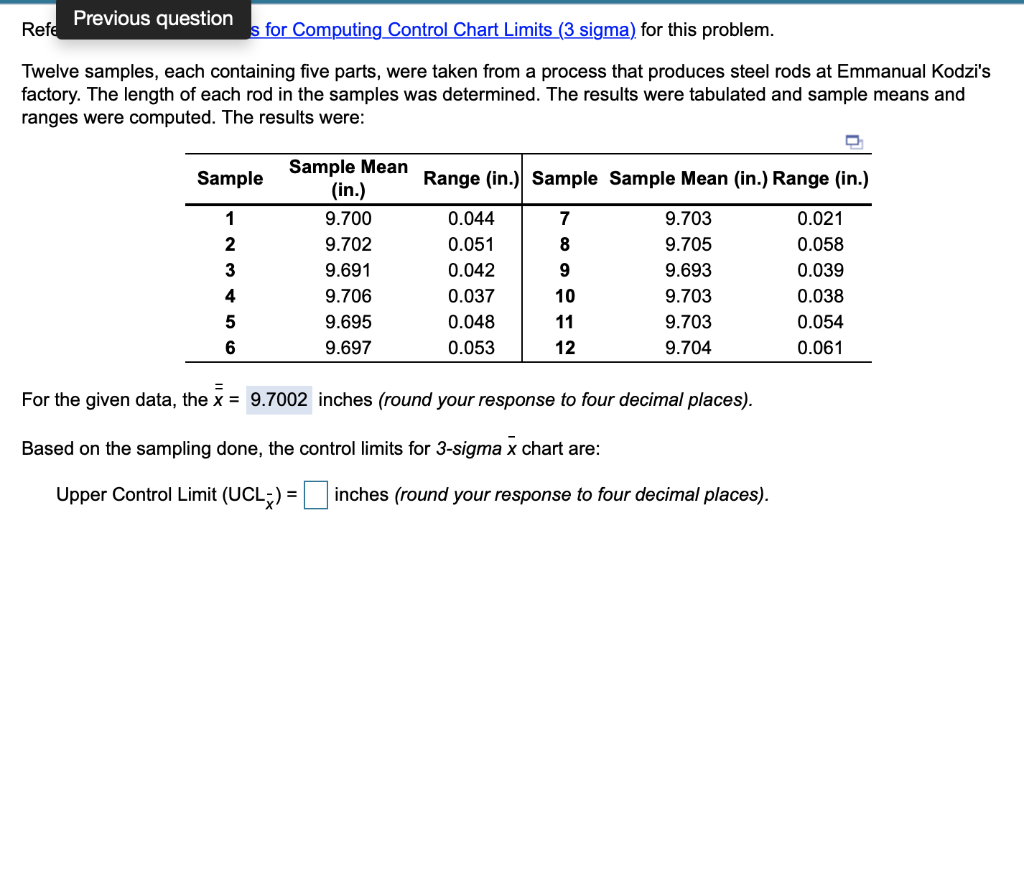
Table is as follows
| Sample Size, n | Mean Factor, A2 | Upper Range, D4 | Lower Range, D3 |
| 2 | 1.880 | 3.268 | 0 |
| 3 | 1.023 | 2.574 | 0 |
| 4 | 0.729 | 2.282 | 0 |
| 5 | 0.577 | 2.115 | 0 |
| 6 | 0.483 | 2.004 | 0 |
| 7 | 0.419 | 1.924 | 0.076 |
| 8 | 0.373 | 1.864 | 0.136 |
| 9 | 0.337 | 1.816 | 0.184 |
| 10 | 0.308 | 1.777 | 0.223 |
| 12 | 0.266 | 1.716 | 0.284 |
There is part 8 parts of this question. I can not move forward until the next answer. Other chegg users may have this on there page if not I can reply in a comment with the rest of them.
Previous question Refe s for Computing Control Chart Limits (3 sigma) for this problem. Twelve samples, each containing five parts, were taken from a process that produces steel rods at Emmanual Kodzi's factory. The length of each rod in the samples was determined. The results were tabulated and sample means and ranges were computed. The results were: Sample Range (in.) Sample Sample Mean (in.) Range (in.) 1 7 8 2 Sample Mean (in.) 9.700 9.702 9.691 9.706 9.695 9.697 3 0.044 0.051 0.042 0.037 0.048 0.053 9 10 9.703 9.705 9.693 9.703 9.703 9.704 0.021 0.058 0.039 0.038 0.054 0.061 4 5 11 12 6 For the given data, the x = 9.7002 inches (round your response to four decimal places). Based on the sampling done, the control limits for 3-sigma x chart are: Upper Control Limit (UCL) = inches (round your response to four decimal places). =Step by Step Solution
There are 3 Steps involved in it
1 Expert Approved Answer
Step: 1 Unlock

Question Has Been Solved by an Expert!
Get step-by-step solutions from verified subject matter experts
Step: 2 Unlock
Step: 3 Unlock