

Question: Table needs to go through December but it wouldn't fit on the screenshot Shoney Video Concepts produces a line of video streaming servers that are
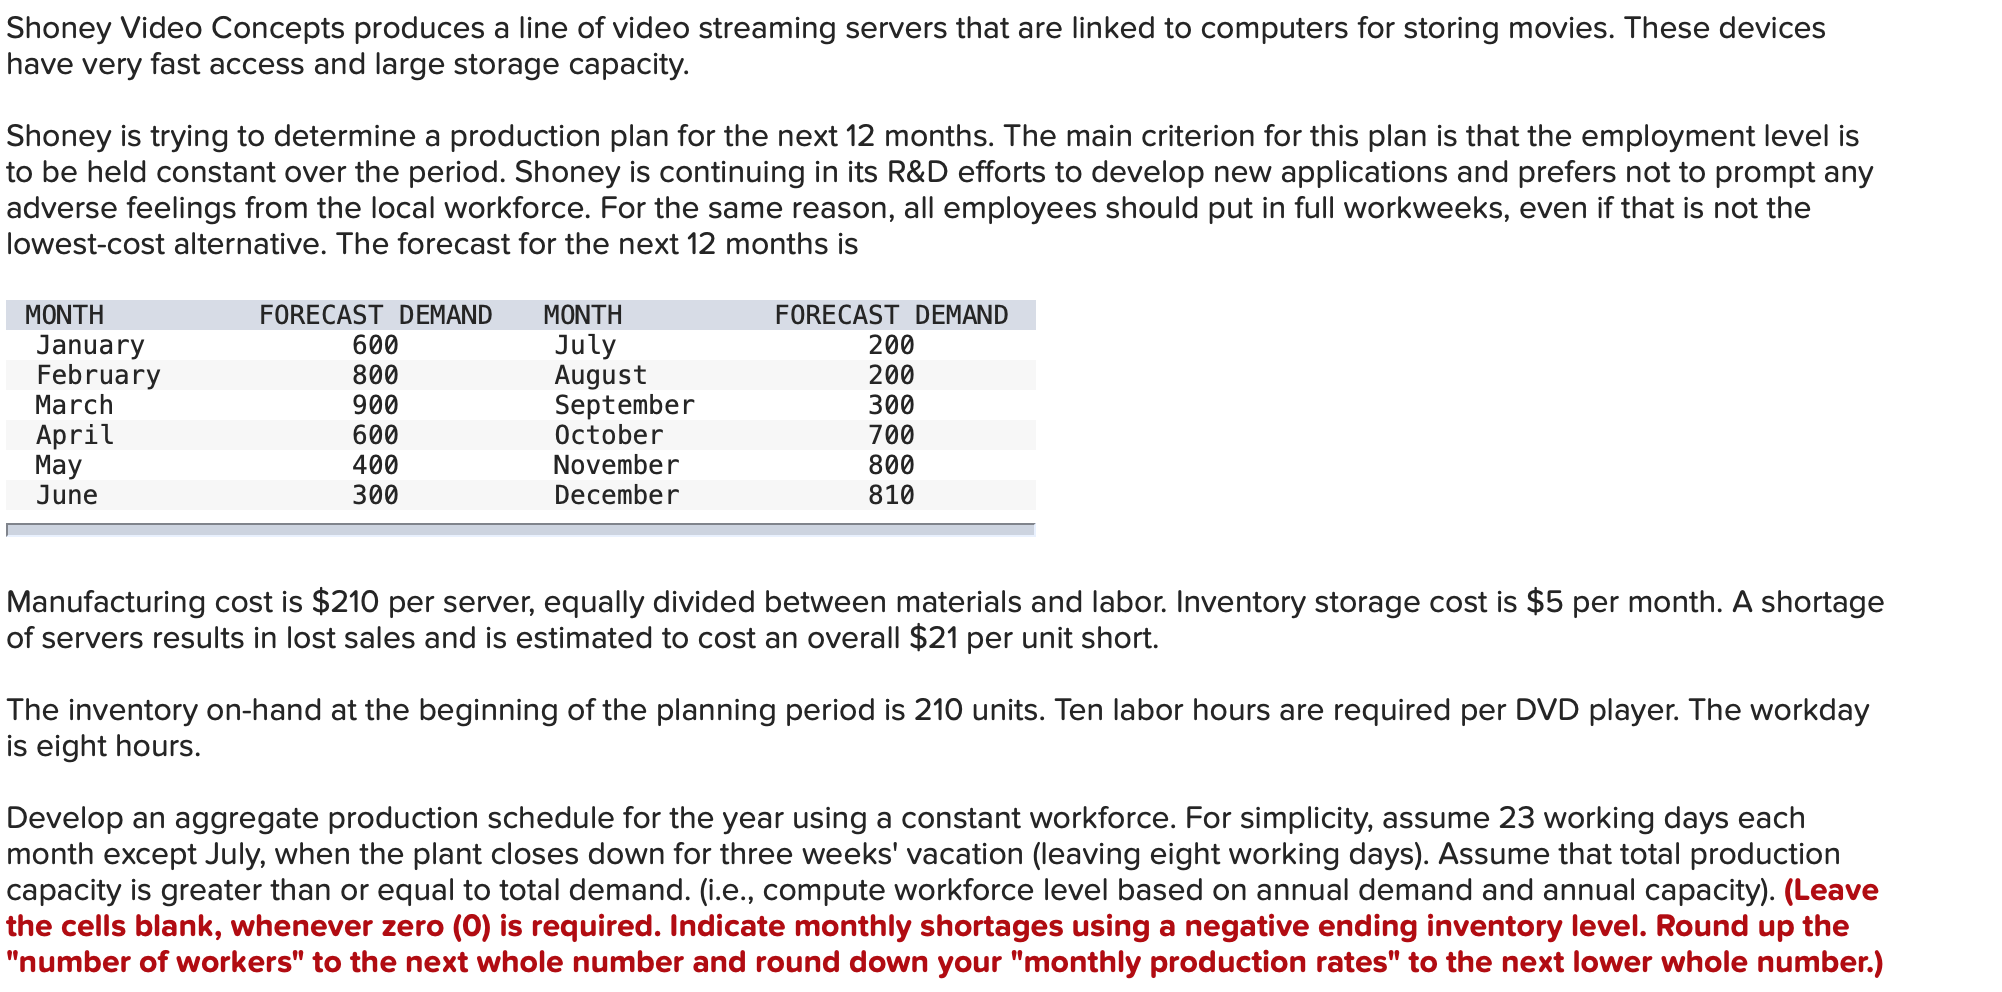
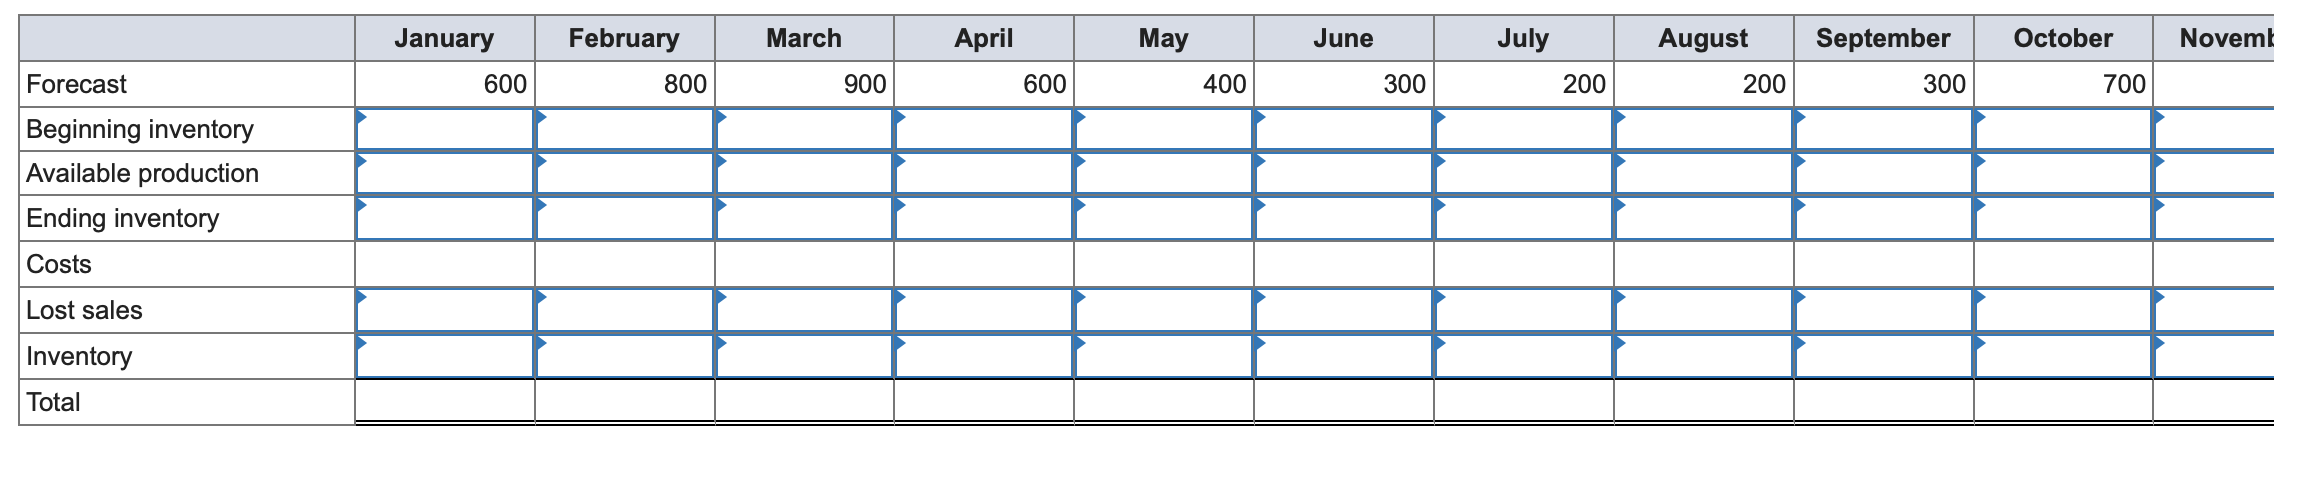 Table needs to go through December but it wouldn't fit on the screenshot
Step by Step Solution
There are 3 Steps involved in it
1 Expert Approved Answer
Step: 1 Unlock

Question Has Been Solved by an Expert!
Get step-by-step solutions from verified subject matter experts
Step: 2 Unlock
Step: 3 Unlock