

Question: Table P 1 - 2 1 Problems 1 . 2 2 and 1 . 2 3 refer to the hydrologic data used in Problem 1
Table P
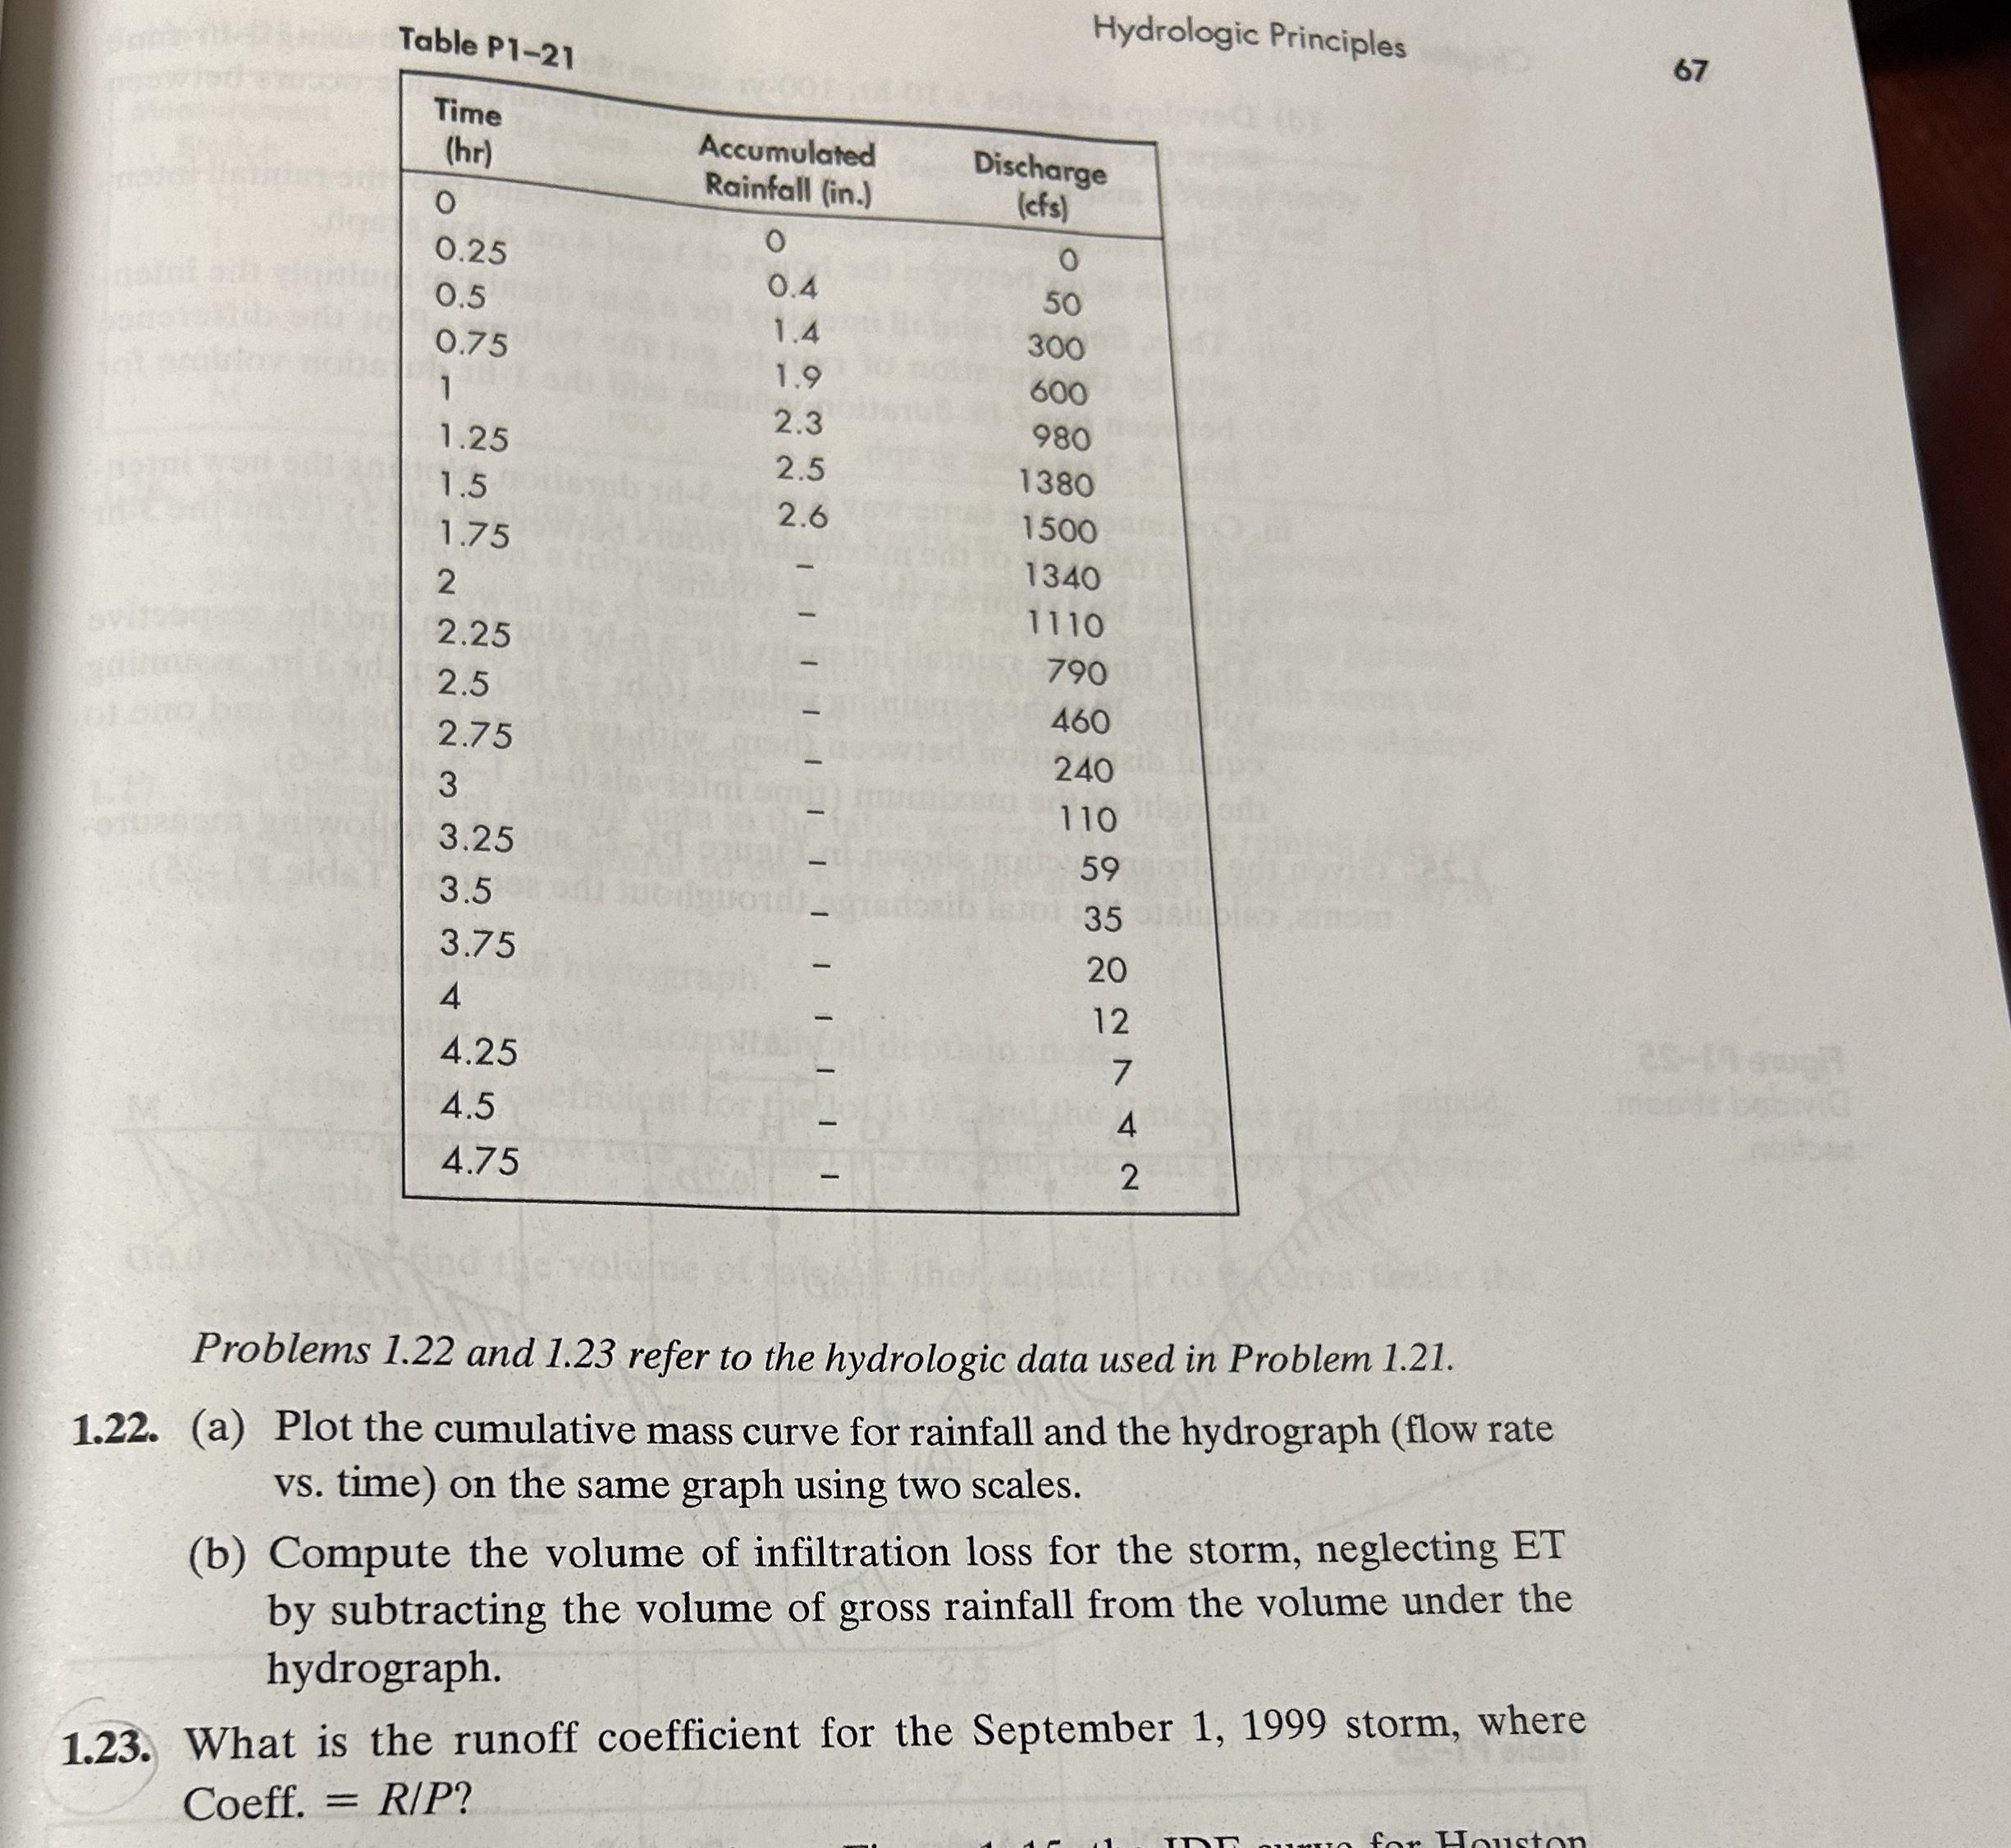
Problems and refer to the hydrologic data used in Problem
a Plot the cumulative mass curve for rainfall and the hydrograph flow rate
vs time on the same graph using two scales.
b Compute the volume of infiltration loss for the storm, neglecting ET
by subtracting the volume of gross rainfall from the volume under the
hydrograph.
What is the runoff coefficient for the September storm, where
Coeff.
Step by Step Solution
There are 3 Steps involved in it
1 Expert Approved Answer
Step: 1 Unlock

Question Has Been Solved by an Expert!
Get step-by-step solutions from verified subject matter experts
Step: 2 Unlock
Step: 3 Unlock