

Question: Table P 2 . 2 shows easting, northing, and measured head for the three wells shown as blue circles in Figure P 2 . 1
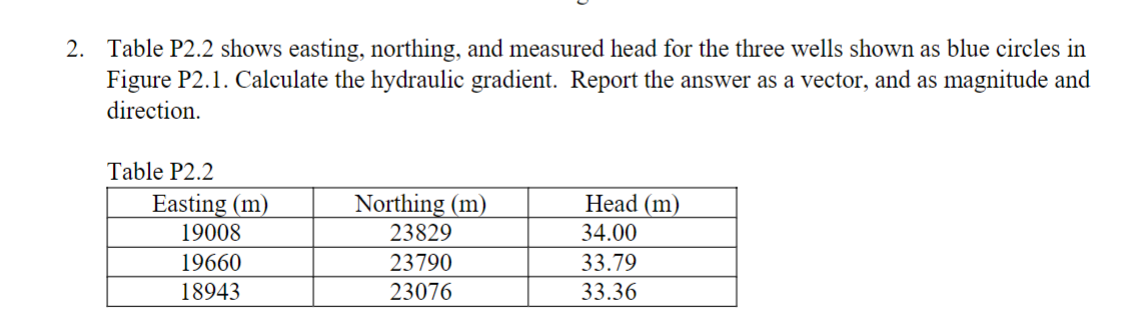
Table P shows easting, northing, and measured head for the three wells shown as blue circles in Figure P Calculate the hydraulic gradient. Report the answer as a vector, and as magnitude and direction.
Table P
tableEasting mNorthing mHead m
Step by Step Solution
There are 3 Steps involved in it
1 Expert Approved Answer
Step: 1 Unlock

Question Has Been Solved by an Expert!
Get step-by-step solutions from verified subject matter experts
Step: 2 Unlock
Step: 3 Unlock