

Question: table [ [ Real wage rate ( 2 0 1 2 dollars ) , Quantity of labor demanded ( billions of horrs per year
tableReal wage rate dollarsQuantity of labor demanded billions of horrs per yeartableQuantity of labor suppliedbillions of hours per yeartableEmploymentbillionsof hoursper yearReal GDP billions of dollarsso
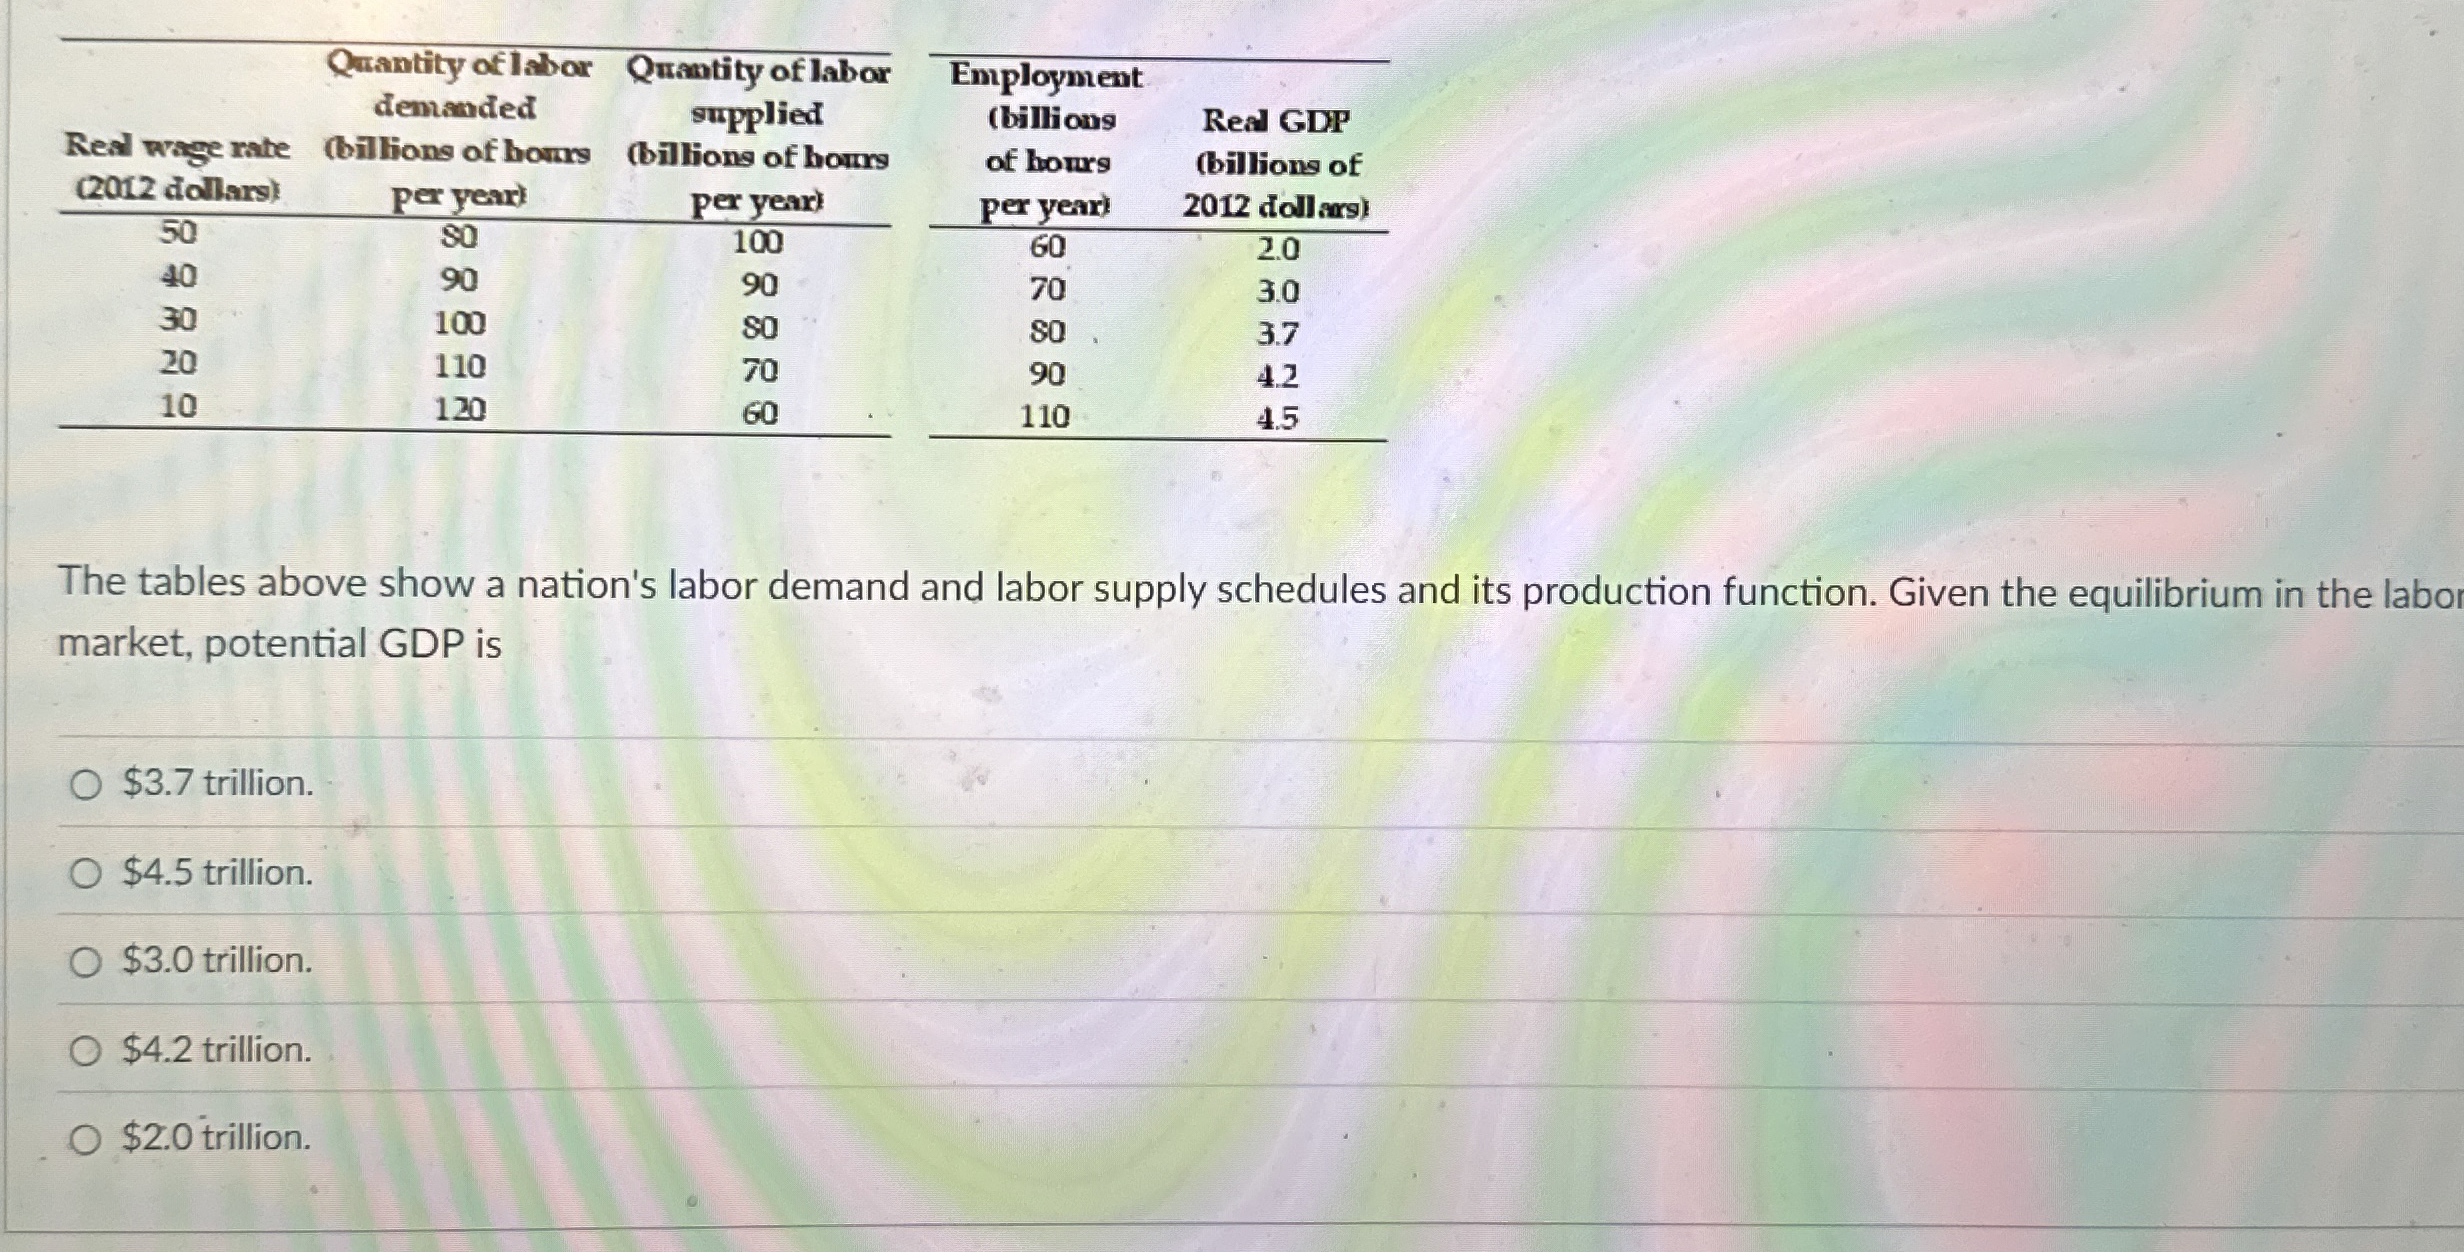
The tables above show a nation's labor demand and labor supply schedules and its production function. Given the equilibrium in the labor market, potential GDP is
$ trillion.
$ trillion.
$ trillion.
$ trillion.
$ trillion.
Step by Step Solution
There are 3 Steps involved in it
1 Expert Approved Answer
Step: 1 Unlock

Question Has Been Solved by an Expert!
Get step-by-step solutions from verified subject matter experts
Step: 2 Unlock
Step: 3 Unlock