

Question: Table S6.1 Refer to Table S6.1 - Factors for Computing Control Chart Limits (3 sigma) for this problem. a) For the given sample size, the
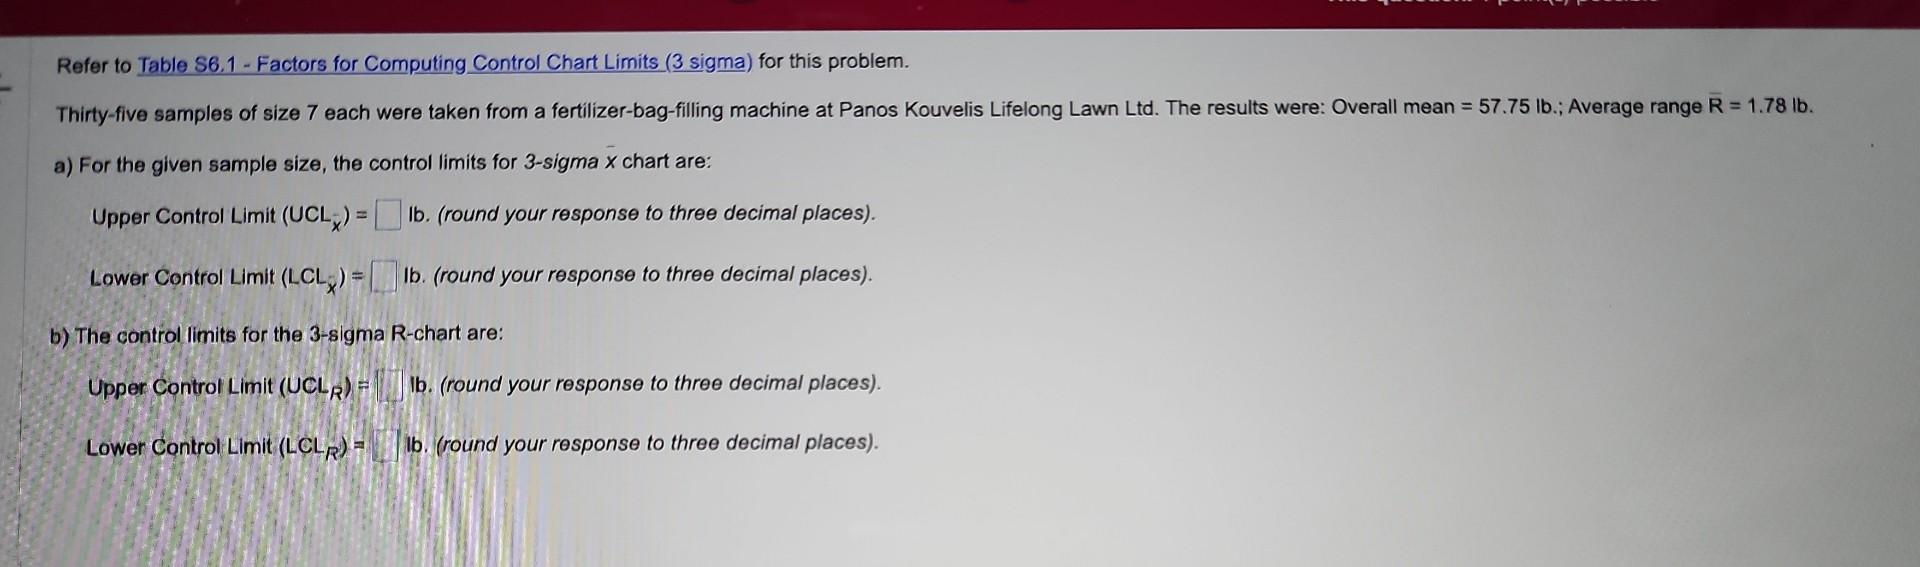
Table S6.1
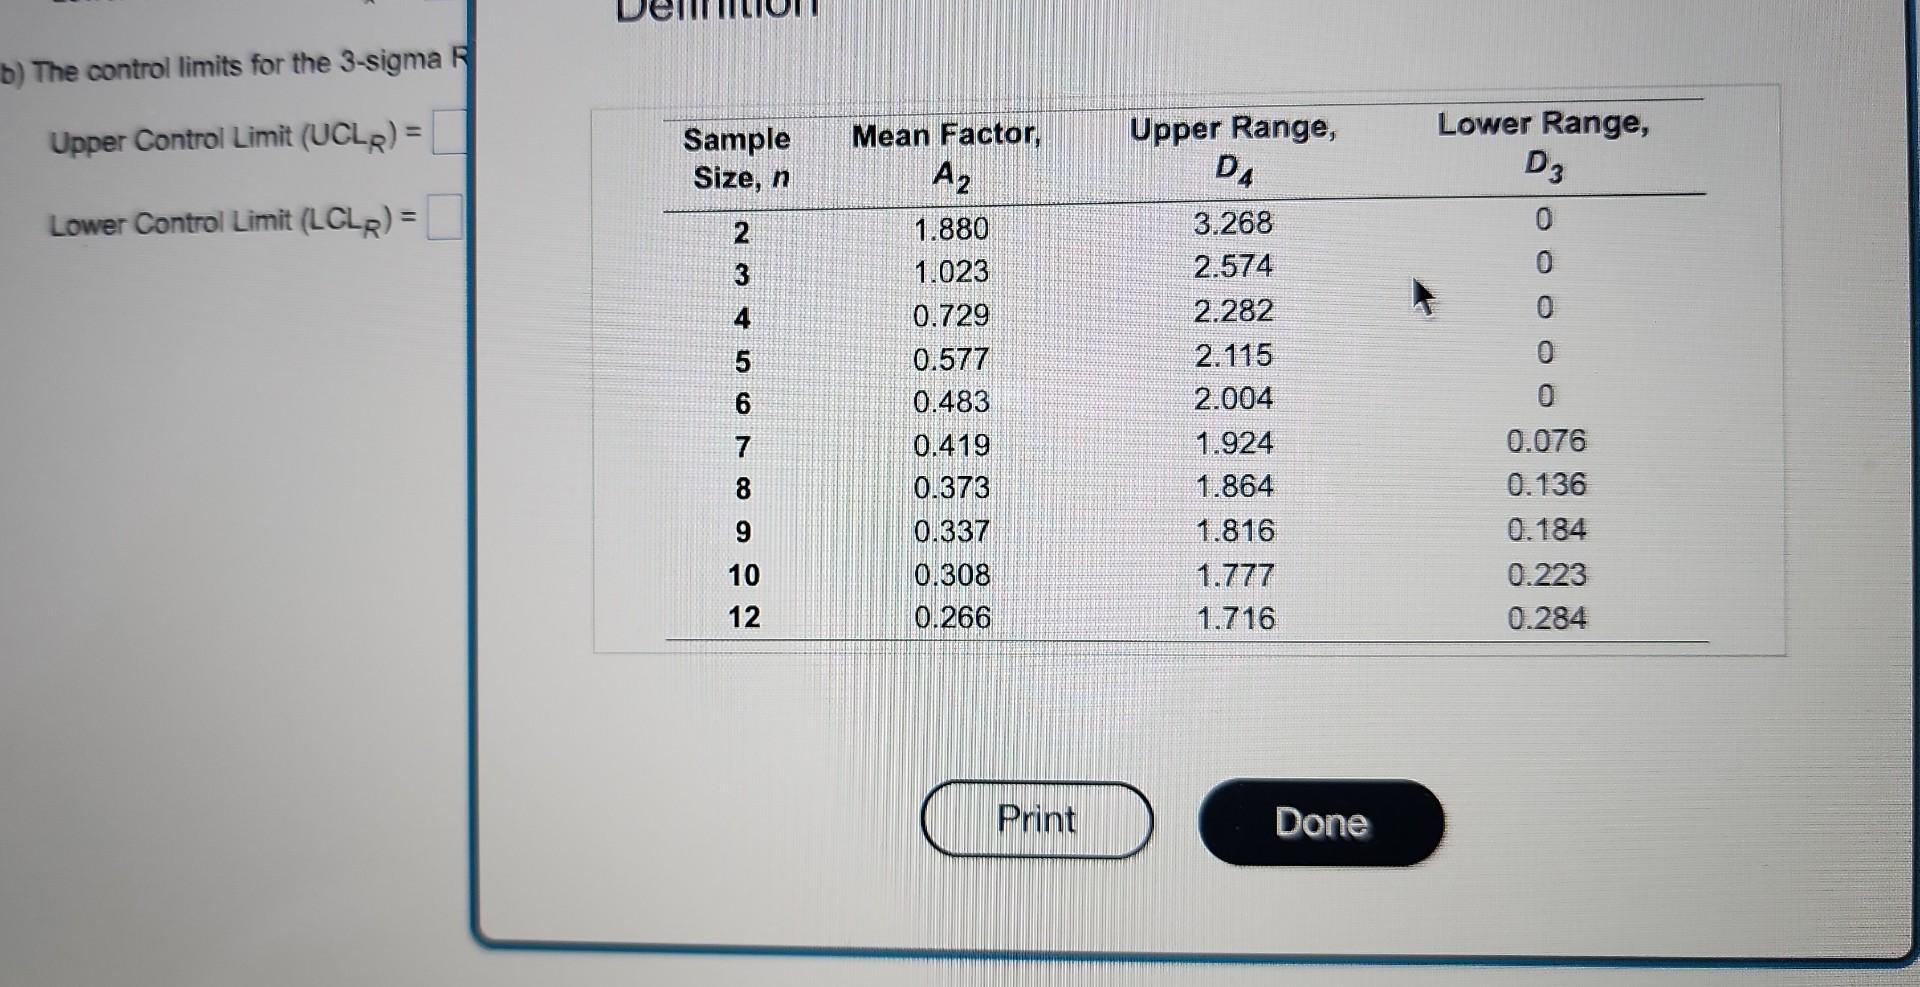
Refer to Table S6.1 - Factors for Computing Control Chart Limits (3 sigma) for this problem. a) For the given sample size, the control limits for 3 -sigma chart are: Upper Control Limit (UCL)= Ib. (round your response to three decimal places). Lower Control Limit (LCLx)= Ib. (round your response to three decimal places). b) The control limits for the 3-sigma R-chart are: Upper Control Limit (UCLR)= lb. (round your response to three decimal places). Lower Control Limit (LLR)= 1b. (round your response to three decimal places). b) The control limits for the 3-sigma Upper Control Limit (UCLR)= Lower Control Limit (LCLR)=
Step by Step Solution
There are 3 Steps involved in it
1 Expert Approved Answer
Step: 1 Unlock

Question Has Been Solved by an Expert!
Get step-by-step solutions from verified subject matter experts
Step: 2 Unlock
Step: 3 Unlock